
The constant monitoring of surface water quality can be challenging particularly if the water body extension is large and if the assessment is based on in-situ measurements. In this case the information of several sample gauges has to be combined and an area-wide estimation has to be made for instance by geostatistical methods. Remote sensing presents a valueable alternative to easily and regularly monitor large water surfaces at a modest time and cost expenditure.
The problem of bad water quality
Algae blooms are the most obvious sign of a bad water quality threatening drinking water, aquacultural farms and the public welfare. They are a very clear warning to react and stop harmful impacts into a water body. However, a significant bloom was recently forecasted for Lake Erie: NOAA predicts that this year’s blooms will be “among the most severe in recent years” and will peak in September (NOAA-News).
Monitoring water surface quality of oceans
A company that is specialized in monitoring water surfaces and water depth from space is EOMAP, based in Munich, Germany. So far the activity concentrated on Asian waters (great Barrier Reef, South China Sea, Red Sea, etc.), where EOMAP has been producing water quality maps, satellite-based bachimetry products, habitat and seafloor classifications as well as terrestrial monitoring. Many of the sites of work concern ecologically vulnerable areas such as coral reefs or mangroves.
From salty to sweet waters
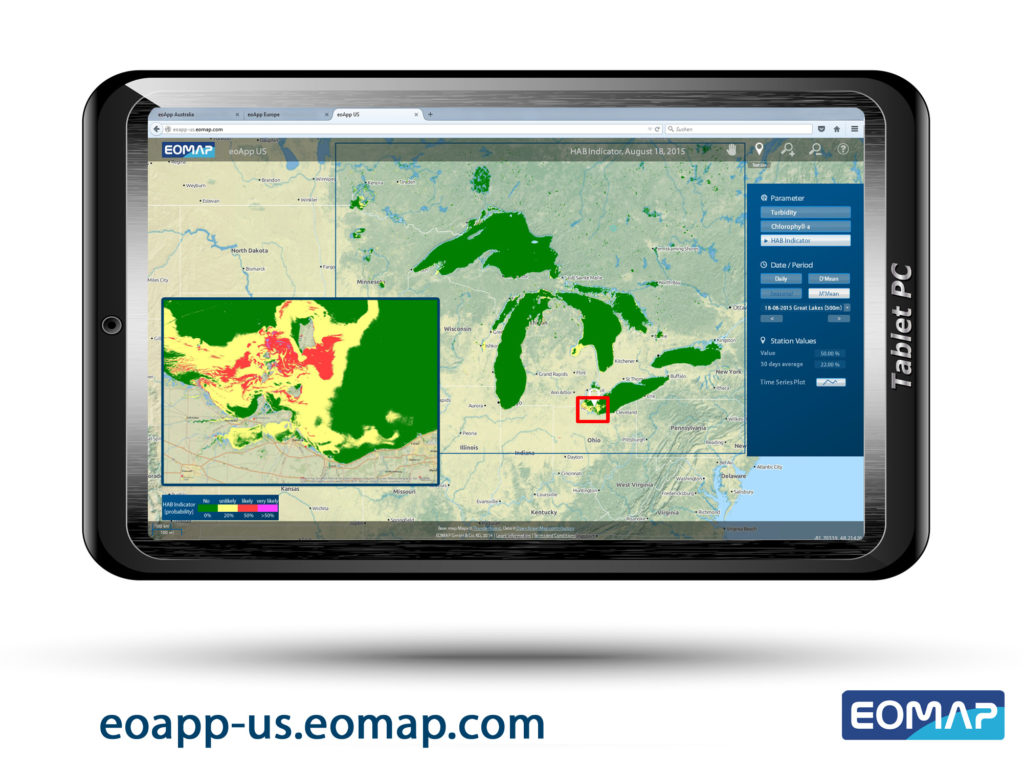
Besides that, EOMAP also tracks the quality of lake surfaces. In this regard the company has recently developed an algae bloom monitoring program for the Great Lakes region. The bloom is now tracked daily and provides free online access through http://eoapp-us.eomap.com/.
EOMAP also tracks the vast number of smaller lakes and coastal waters globally using its multi-satellite monitoring system and displays this data on the eoApp web application. Aside from single, daily products, the application also provides spatially and temporally aggregated data: daily means (D’mean) and moving, weekly means (M’mean).
The eoapp monitoring system allows for tracking blue algae blooms and relevant water quality parameters such as chlorophyll and turbidity. Various US and European satellite sensors are imbedded into this first globally harmonized monitoring system, supporting daily monitoring at continental scales, historical reviews up to 30 years back in time and highest spatial resolutions for ponds, small lakes and rivers. Matt Bergin, Vice President of business Development at EOMAP states that ‘EOMAP supports European and US research initiatives to understand and forecast harmful algae blooms. The heavy bloom in 2015 was already well detected and well accessible through eoApp. The algorithm developed by EOMAP detects blue algae containing phycocyanin pigments. It is imbedded into the proprietary, state-of-the-art satellite data processors of EOMAP, which already are installed in several satellite receiving and archiving centers to support the most cost efficient and fast production.’

Tablet PC with GPS in original design. Vector
The HAB Indicator is an indicator for the probability of algae blooms to occur. The map shows the moving mean of the last seven days for the Lake Erie. Source: eoAPP US
Turbidity map of the Lake Erie (moving mean of the last seven days). Source: eoAPP US

#


Next article
Water resource managment and Remote Sensing, a prospective issue that requires considerable attention

Background:
Water Remote sensing is a means of monitoring the water color and temperature, which provides information on the presence and loads of optically active substances in the water and that has hundreds of practical applications in the arena water resource management.
For an example, Surface runoff from agricultural land can carry nutrients (i.e., nitrogen and phosphorus from fertilization of crops) into that water bodies that might cause algal blooms and have the potential to degrade the water quality (i.e., fish kills). Satellite remote sensing derived indicators such as chlorophyll, can monitor that algal bloom thus monitoring water quality in a spatio-temporal fashion.
Incessant pressure on water resource caused by population growth and climate variability is obvious and there is a little quantitative information available to capture the spatial and temporal variability in water quality and quantity and therefore hard to derive efficient and effective water resource management policy.
Water Remote Sensing Applications:
Satellite Remote Sensing (RS) or Earth Observation (EO) can be crucial in understanding the spatio-temporal dynamics of water quantity and quality, which can be used to simulate water resources management scenarios under different water quantity/quality demand and derive effective policy recommendations, accordingly. Besides, EO also can competently assist different phases of water resource management projects’ life-cycle. In this context, Some of the widely used RS techniques are itemed bellow:
Surface Water Quantity: In context of water resource management, one of the key argument is the lack of the ground data, which plays an important role in evaluating the status of water resource and taking useful measures to respond the threat of water scarcity. In this regard, EO can offers standardized and long-term observations to address such challenges.
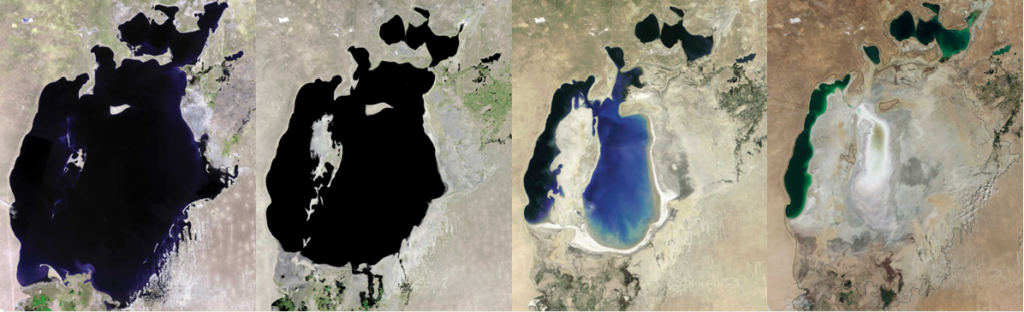
The EO capability of multi-temporal imaging and satellite imagery based indices (i.e., Normalized Difference Water Index (NDWI)), can efficiently identify, map and calculate the total surface area of the water bodies in different seasons (i.e., dry, wet) and by integrating satellite altimetry measurements we can quantify and monitor the water storage change over time.

The Aral Sea was once the world’s fourth-largest lake, but as can be seen in the four satellite images, has decreased in size over the last forty years; Images: USGS, EROS Data Center
Ground water Quantity: For planning and management of our water resource, we need to know, globally how much fresh water we have. Gravity Recovery and Climate Experiment (GRACE), an EO mission made possible to have an idea of how much ground water we have and how much we are extracting every day that was almost impossible to quantify few years back.
GRACE continuously measuring the changes in earth’s mass hence gravity that are mainly due to water moving on and under the surface. The negative change in gravity is the indication of losing mass, which means falling water table and by monitoring the changes over time we can estimate the rate of diminishing water table, which has strong water policy implication.
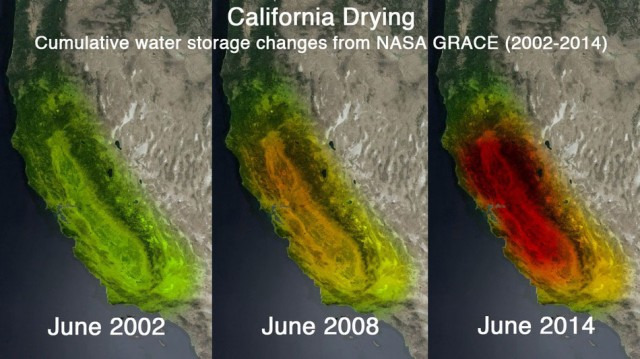
GRACE satellite data showing California’s groundwater depletion in recent years. Image: NASA JPL
Surface Water Quality: Regarding water quality, there are several indicators, which are commonly used to describe and assess the water quality. Such as, water temperature, nutrients presence and abundance, total suspended solid, turbidity, presence of humic substances etc. EO can efficiently communicate with almost all kind of mentioned indicators very efficiently. For an instance, one of the most popular remote sensing based water quality parameters is chlorophyll-a, which can explain the nutrients presence and abundance in the water. Besides, Total Suspended Matter (TSM) concentrations as well as attenuation coefficient (Kd) can be used to measure the water turbidity and Colored Dissolved Organic Matter (CDOM) can play the proxy role to assess the presence of humic substances in the water.
Multi-temporal analysis of these remote sensing based parameters can provide more deeper understanding of our water quality dynamics or variability over time (i.e., seasonal or long-term). Besides, remote sensing based water quality indicators in combination with land use and other spatial information, we can successfully not only detect the eutrophication sources but also can understand the mechanisms, which are most likely caused by high rate of unmanaged urbanization and intensification of agricultural use of lands surrounding the water bodies which put pressures on the water bodies’ ecosystem.
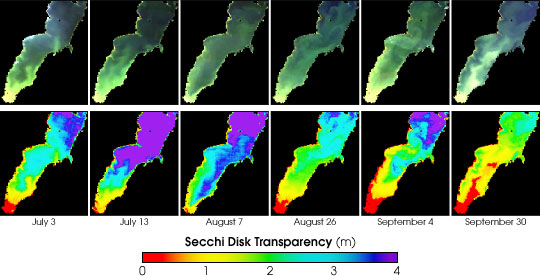
These images show true-color imagery and water quality (i.e., water clarity) data for Green Bay, Wisconsin during the summer of 2001. (Images courtesy Jonathan Chipman, Center for Limnology and Environmental Remote Sensing Center, University of Wisconsin)
Ground Water Quality: Besides the surface water quality assessment, we also can study ground water quality assessment using remote sensing technologies. For an example, we know groundwater discharge (GD) is a potential source of nutrients and algal bloom, which is an indicator of nutrient release in the water bodies. Now, If we know about the seasonal variability of ground water discharge and if the seasonal algal blooming variability correlates with the GD variability that can be an indicator of groundwater quality.
Water Project Management: EO-based information can be of important in view of implementing, coordinating, and monitoring large-scale water related projects and long term strategic planning (i.e. definition of priority interventions or understanding risks and vulnerabilities etc.). Different EO aided development projects has demonstrated the potentials of EO in water related project management.
For an example conducting projects on cross-boundary or trans-boundary water management issues are always difficult and complex in manner, regarding data collection and harmonization of available datasets where the particular advantage of EO is, EO service Information is globally consistent in nature that can facilitate the comparison capability of spatial facts and figures. Besides, EO based global water quality monitoring can identify where the water quality is deteriorating and requires local monitoring and water management program to tackle local challenges.
Last but not the least, EO also cal play a crucial role in project evaluation or impact assessment. Using EO information service we can very easily measure, either a water quality improvement project has met the goal or not by just analyzing satellite image in no time.
Conclusion:
The possibility of EO can potentially optimize the ground measurements and in such sense EO is simply awesome and can play a crucial role in water resource management but there are several changelings that we need to attain to successfully couple water specialist with EO. It’s obvious that EO information services are not widely used in the water resource management and one of the main reason of freely available EO data been underutilized due to the lack of staff capacity for processing and accessing EO data.
On the other hand the EO professionals’ density in land RS is remarkably higher than Water RS and to make water RS trendy, we should promote Water RS among the EO professionals. Besides, the number of studies/research on water RS or with water RS, are also not that significant, which should be enhanced by funding water RS related projects.