
Editor’s note: This article was written as part of EO Hub – a journalistic collaboration between UP42 and Geoawesomeness. Created for policymakers, decision-makers, geospatial experts and enthusiasts alike, EO Hub is a key resource for anyone trying to understand how Earth observation is transforming our world. Read more about EO Hub here.
The Pléiades Neo 30-cm resolution satellite constellation from Airbus offers unprecedented visual quality. Although some other constellations offer the same pixel size, the clarity of the Pléiades Neo images is mind-boggling. It feels more like aerial than satellite data.
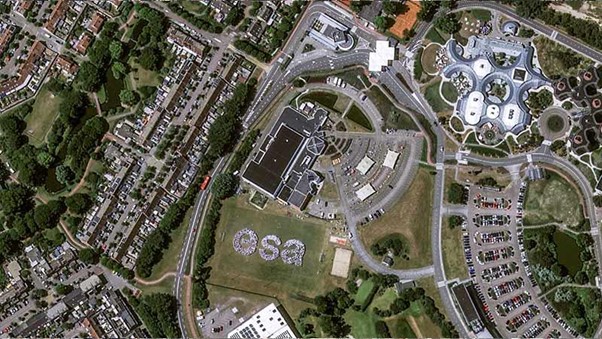
To show off the satellite’s incredible abilities, the European Space Agency (ESA) organised a group photo of 1,000 ESA personnel — from space. The personnel gathered on a rugby field, holding pieces of white paper on their heads, and stood in a formation that spelled the letters “esa.” The entire event had to be timed precisely as the satellite passed 700 km overhead.
The constellation is designed to offer a high revisit rate, allowing it to capture any location up to three times a day. Also, its spectral bands, including Red Edge and Deep Blue, enable new possibilities and applications.
Understandably, the geospatial industry is already eager to get their hands on Pléiades Neo data.
Buying satellite data has traditionally been extremely difficult
Even though buying satellite data is getting easier every month, it is still quite challenging.
The difficulties in easily obtaining satellite data are more apparent when dealing with very high-resolution imagery such as Pléiades Neo. There just wasn’t any marketplace around that provided a simple interface to browse available data. To preview and purchase Pléiades Neo data, it was necessary to go through customer support. This is a major drawback, especially for projects where you need data in a hurry.
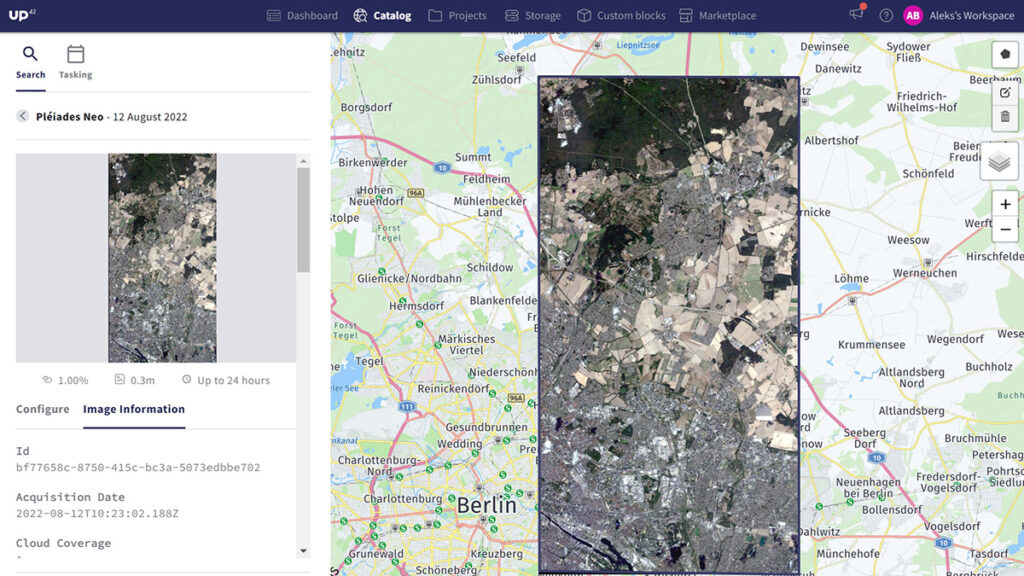
This problem was solved by UP42, a Berlin-based startup that offers an online marketplace for customers to purchase satellite data and algorithms at scale. UP42’s latest platform release now adds the ability to preview and buy the high-res Pléiades Neo images immediately online without contacting sales. The search and purchasing process is also highly intuitive. Finding the right satellite scene is extremely easy. Here’s how it works:
How does Pléiades Neo preview on UP42 platform work?
UP42 has provided an intuitive interface to zoom in on an area and preview all available archive Pléiades Neo satellite data(or other satellites they have imagery for, such as Pléiades, SPOT 6/7, and TripleSat).
Users can type in a physical address for the area they’re searching for, or draw a polygon on the map. They can also upload areas of interest in GeoJSON, KML, or Well-Known Text formats.
UP42 then provides search results for the data archive. The results are not in full resolution, but they are close enough to give the user a good idea of whether they want to purchase that data or not.
Once the user is satisfied that they’ve found the data they need, they can purchase the dataset with just a few clicks. The platform needs a bit of time to process the data (usually a few hours), and then the user can download the data.
Applications of Pléiades Neo
After buying Pléiades Neo, users can finally explore the wealth of possibilities and use cases it enables.
The data offers 30cm panchromatic resolution, with 1.2m resolution images in multispectral channels, making it highly useful for applications requiring close monitoring and counting of assets and infrastructure.
The positioning accuracy of the images is up to 3.5m, which makes it valuable for any use case that could benefit from change detection over time and overlaying other data layers, such as progress monitoring of a construction project.
Moreover, Pléiades Neo can be tasked, and its data downloaded and ready for analysis in below two hours, which makes it a game changer for emergency situations and disaster management.
The addition of the Red Edge spectral band enables more precise vegetation analysis and will support improved crop health analysis critical for precision agriculture.
On the other hand, the Deep Blue band is intended for hydrological and bathymetry applications. It allows deeper penetration into water bodies for a clearer understanding of waterways and improved safety in maritime navigation.
Buying high-res data must be easier
Very high-resolution satellite data is undoubtedly the future of Earth Observation. The more pixels and bands you have the more information can be extracted. In December 2021, Albedo, a start-up based in Austin, TX and Denver, CO, was granted an NOAA license to sell commercial optical imagery of their future constellation with a resolution of 10 cm, which suggests that even higher GSD data are just behind the corner.
The ease of buying very high-resolution satellite data must be improved for non-government users to unlock the full potential of such data for the benefit of society and the environment. At the same time, the higher the resolution, the more challenging data processing, storing, and analysing is. Users will not be able to effectively work with hundreds of gigabytes of data on their local PCs.
The role of platforms such as UP42 in buying and analysing very high-resolution satellite data will be critical. However, with the release of the new Pléiades Neo preview feature, we are getting there one step at a time.
Did you like the article? Subscribe to our monthly newsletter

#Data source
Next article
How Satellite Data Is Helping Tackle the Urban Heat Issue
Editor’s note: This article was written as part of EO Hub – a journalistic collaboration between UP42 and Geoawesomeness. Created for policymakers, decision makers, geospatial experts and enthusiasts alike, EO Hub is a key resource for anyone trying to understand how Earth observation is transforming our world. Read more about EO Hub here.
In 2018, 55% of the world’s population lived in urban areas. This number is projected to grow to 68% in 2050, according to data from the United Nations.
City streets catch and hold more heat than their surrounding areas. In addition, materials such as concrete affect the thermal energy dynamics to bring about zones that are generally a few degrees higher than non-urban zones.
These overheated urban areas are called Urban Heat Islands (UHIs), and they can cause reduced air quality, higher demand for water, and even heat casualties. For example, on an average “heat day,” Los Angeles County emergency rooms see an additional 1,500 heat-related patients.
But satellite data now allows for large-scale detection and monitoring of UHIs, and can be used in combination with heat-reducing techniques to improve the situation. The wide availability of satellite data, thanks to platforms such as UP42, makes it easy for companies and researchers to access and analyse the data at scale.
One notable example is data from NASA’s ECOSTRESS — the ECOsystem Spaceborne Thermal Radiometer Experiment on the International Space Station — which has successfully been used by several Los Angeles neighbourhoods to help determine what works to reduce UHI temperatures.
Dr Glynn Hulley of the Carbon Cycle and Ecosystems group at NASA’s Jet Propulsion Laboratory (JPL) spoke recently on a USGS podcast, detailing how ECOSTRESS works. He explained the difficulties in getting accurate and timely temperature measurements using ground sensors:
“There are [ground-based] sensors in different cities around the world operated by NOAA and NASA and other agencies,” he said, “but they’re pretty sparse. And so, they measure the general air temperature at a neighbourhood level. So for example, there are about three or four sensors in the San Fernando Valley in Los Angeles. The real benefit of the spaceborne data is that we can measure that routinely almost every day, but also at very high spatial resolution. With ECOSTRESS, the resolution there is about 70 by 70 meters for each pixel — that’s roughly the size of a football field. And we can measure that almost every day.”
Because ECOSTRESS satellite data is so comprehensive and obtained so quickly, it is the easiest way to rapidly establish if a neighbourhood cooling project is working or not.
The other reason ECOSTRESS is especially suited to obtaining comprehensive measurements is that it obtains temperature readings at various times of the day, every other day, building a history of the diurnal cycle that can be used for analysis. The reason for this is due to the ISS’s precessing orbit. “That’s a very powerful tool,” said Dr. Hulley. “And there’s no other sensor right now that is able to achieve that high frequency.”
For example, Landsat 8 and 9 provide readings at 10:00 AM and so are unable to give a nighttime view of the effects of urban heating.
ECOSTRESS’s extremely fine spatial resolution also lets it provide detailed info at the neighborhood level.
Using satellite data to help LA reduce Urban Heat Islands temperatures
Dr. Hulley teamed up with Chief Sustainability Officer for Streets LA, Greg Spotts, to show exactly how this satellite data could be used to determine if cooling efforts in LA neighborhoods were working.
Spotts had previously used cool pavement coating to cool down various city blocks in LA, but didn’t have access to the testing and sensor data that satellite imagery could provide.
After meeting at a NASA briefing, the two men arranged to run a pilot in several LA neighborhoods, starting in the spring of 2019. They were going to coat certain neighborhood streets with cool pavement coating and then use ECOSTRESS data and imagery to determine if the coating had a positive effect on UHIs.
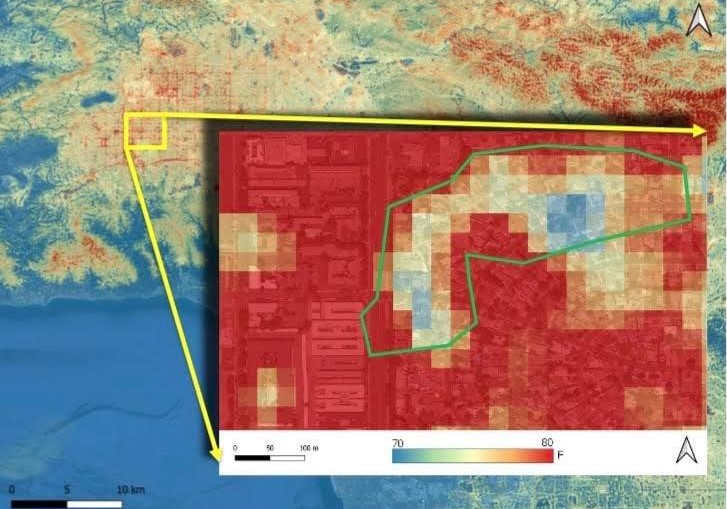
One of the neighborhoods they piloted was Winnetka in the San Fernando Valley. The area that they coated in that neighborhood with the cool pavement coating — Stephanie Drive, an eleven-block section including five cul-de-sacs — happened to be in the shape of a crescent.
When the ECOSTRESS heat map data became available, the crescent shape of the coated Winnetka neighborhood stood out starkly compared to the rest of the map. The crescent-shaped area was a cool blue compared to the red areas surrounding it, as shown in the image below.