
Kazakhstan launched its first satellite KazEOSat-1 on 29 April 2014 from French Guyana Space Centre. After several postponements the satellite was carried into space by a Vega launcher, which is due to launch small satellites into low Earth orbit or Sun-synchronous orbit.
KazEOSat-1 is a high resolution satellite achieving 1m pixel size on earth surface by integrated cutting-edge technologies. It will provide a range of civilian applications comprising monitoring of natural and agricultural resources, mapping data and support for search and rescue operations during natural disasters. Kazakhstan is the 9th largest country in the world, its vast remote areas from now on can be observed and monitored from space.
KazEOSat-1 is the high resoution part of a earth observationn system that will comprise two satellites and one ground station. The medium resolution element will be KazEOSat-2 that is under construction. The projected life time of KazEOSat-1 slightly succeeds 7 years. KazEOSat-1 was entirely built by Airbus Defence and Space, which today counts as the second largest space company. KazEOSat-2 is being built by SSTL, a British subsidiary of Airbus Defence and Space.
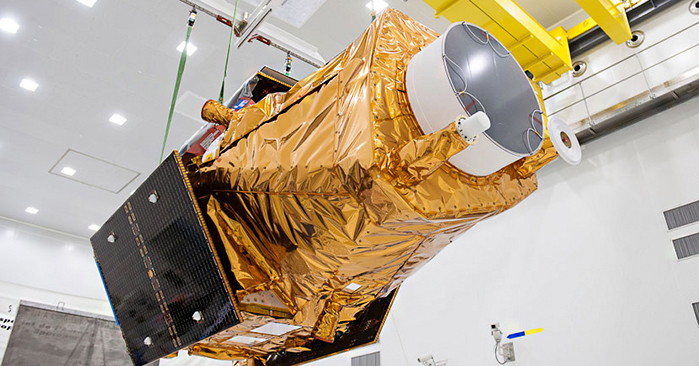
KazEOSat-1 on the ground.
A video on KazEOSat-1 is here.
Source: Geospatial World

#

Next article

Last week the European Geosciences Union held its annual General Assembly in Vienna, Austria. EGU is Europe’s premier geosciences union, dedicated to the pursuit of excellence in the geosciences and the planetary and space sciences for the benefit of humanity, worldwide. It belongs to one of the biggest conferences in the world. Just to give you an idea, this year a total number of 4.829 oral presentations, 9.583 posters, 483 PICO presentations and 568 unique scientific sessions attracted an audience of 12.437 scientists from 106 different countries, of which 27% were students. I attended the meeting during two days – unfortunately I could not stay the whole week due to professional reasons – and was impressed by its dimension: The location of Vienna International Centre with several floors, numerous conference rooms and dozens of halls offers incredibly much space for scientific exchange. It seemed like a world per se comparable to a cruiser or a big hospital, where people pull together and engage in the same topic – the Face of the World. – It refers to the diverse shape of our planet Earth and comprises all kind of geosciences ranging from geology, hydrology, soil science to athmospheric and space related sciences. It’s a very brought topic that permits a huge variety of scientific discussion. Although, I was embraced to see what’s happening in other areas than my personal favourite ones, I was trying to pick up remote sensing and GIS news and hereby want to present you some interesting things I got to know.
GOOGLE EARTH ENGINE
The entrance area on the ground floor was reserved for companies and institutions acting in the geo and space domain. At their stand, Google presented the newest features associated with the google earth engine. Google Earth Engine was launched 2010 as an on-line platform gathering satellite images from publicly available satellites LANDSAT and MODIS. Due to the long life time of the satellites comprising a time span of over 25 years (1984-2012) an unprecedented amount of satellite imagery was put together with the new google earth engine technology and rendered publicly available. Due to the planetary scale, Google Earth Engine permits global-scale monitoring, data analysis and measurement of changes in the earth’s environment (surface). The kinds of potential applications range from mapping water resources to ecosystem services to deforestation and are part of our broader effort at Google to build a more sustainable future.
How does it work?
Access to Google Earth Engine itself is currently available as a limited release to a small group of partners. Interested persons or institutions are welcome to request collaboration at Google. The privilege but at the same time the mission of those parties is to prompt the development of new algorithms for data analysis based on the collection of satellite imagery and to render the projects available for public. Still the outcome of Google Earth Engine projects is viewable for everyone.
Google Earth Engine Interface
On the interface you will find three sections (to choose at the upper right): the ‘home’ section is the default interface and offers a selection of precomputed projects, which pick up the change on earth surface over time. Some important examples are the deforestation in Amazonia in the last 25 years, the loss of water surface of lakeAral within the last two decades, Dubai coastal extension or the growth of Las Vegas (see some Videos).
In the ‘data catalog’ you select your desired product from a list of available satellite products. Effectively, you can choose between a daily, weekly or monthly product of surface reflectance, radiance or a number of other composed features (indices) as NDVI, NDWI, BAI or TOA reflectance from LANDSAT or MODIS sensor. Even a SRTM is available. By clicking ‘open in workspace’ you will incorporate the product to the surface map of the world. The visual appearance of each product can be edited to retrieve some simple analysis. For instance, the DEM (SRTM) can be used to set height limit for a desires altitude, in order to exclude certain levels (e.g. colouring only the land below 1000m a.s.). Also, a time controller enables to change dates examining the succession (alternation) of a product over the year (intra-annual cycle) or over the decades (inter-annual changes).
At the the EGU stand, Google presented some of the most recent pre-computed projects of Google Earth Engine. In a previous article I already presented globalforestwatch and the first 30m map of global forest change established by University of Maryland, which are already web-published studies on the forest extension and alternation in forest surface based on Google Earth Engine satellite imagery.
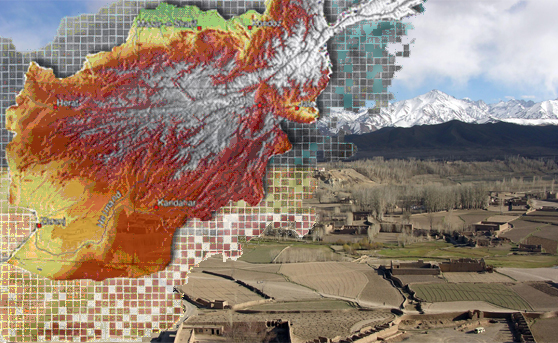
A very impressive feature presented at EGU was an algorithm for land surface classification that visualises all kinds types of land use/cover of selected areas. The algorithm may be applied in different projects. For instance, the USGS web-published project shown in the map below shows land classes in America and as a special topic also debates the issue of land fires in California. Other areas can be downloaded as shapefiles.
The interface of Google Earth Engine is a separated window view showing the code of the algorithm (Python or JS) in the upper window and the map at the bottom to which the code is applied. The lines can be altered enabling the extension or improvement of an algorithm.
There is plenty of material being analysed and published using google earth engine technology. It seems like a playground for interested people in earth observatio!
For more information go to:
Google Earth Engine at EGU 2014
Google Earth Engine – height information based on SRMT in Northern Italy: The altitude above 1000m sealevel is coloured white.
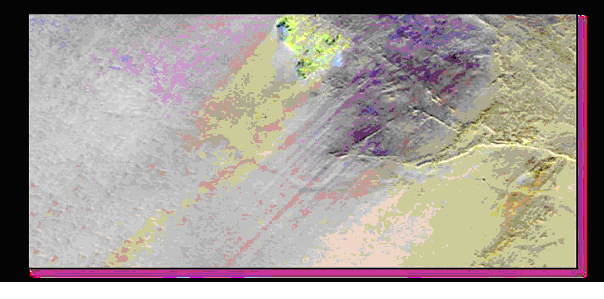
Google Earth Engine – LANDSAT 7 32-Day EVI-Composite from the Iberian Peninsula. The map shows artefacts (EVI values in the ocean) and the striping effect of LANDSAT 7 sensor.
Google Earth Engine – USGS Landfire Data distribution map showing land classes.
OCEAN DATA INTEROPERABILITY PLATFORM (ODIP)
So far, Google Earth Engine only compiles information on land surfaces. The focus area of the European research program horizon2020 in 2014/15 is the ocean. Thus, at this point I would like to mention a platform that focuses on data administration associated with oceans. ODIP is trying to facilitate the discovery and access of marine data through the development, implementation, population and operation of national, regional or international distributed ocean and marine observing and data management infrastructures such as SeaDataNet, Geo-Seas, IOOS, the Australian Ocean Portal and the IODE Ocean Data Portal. All of these developments are resulting in the development and implementation of standards for the formats of metadata, data, data products, quality control methods and flags, common vocabularies. They are also providing services for data discovery, viewing and downloading, and software tools for editing, conversions, communication, analysis and presentation, all of which are increasingly being adopted and used by their national and regional marine communities.
SENTINEL
A big issue of the meeting was the Sentinel series from ESA. Sentinel-1A was already launched on April 3 2014 and is going to deliver radar data at an unprecedented resolution and therefore also amount of data. The radar data are going to provide new opportunities in data anylsis and extraction. Under the scientific exploitation of operational missions (SEOM) ESA develops open data toolboxes for their upcoming missions. Three toolboxes (S1, S2, and S3) will be available only for Sentinel-1 providing enhanced analysis potential for the radar data enabling, for instance, to work with a new combination of polarisation modes and high resolution DEMs. An important issue for the toolboxes is their data interoperability – also with the future missions of ESA. The toolboxes for Sentinel-1 will be available in September 2014.
– For information on SEOM and ESA Workshops click here.
Due to the large data amount of the new satellite series, new ways of dealing with the data and particularly its transfer have to be found. The group of Prof. Wagner at Technical University Vienna is working on the establishment of an Earth Observation Data Centre (EODC). The scope of an EODC is to provide a platform to retrieve land surface data from past and future radar sensors for the entire globe. The work involves the establishment of an adequate projection and grid for each continent, data storage, data transfer etc. Due to the large amount of data, a new super computer is being installed at TU Vienna. As ESA promotes an open data use, the EODC is planned to operate open source as well, the data will be publicly available.
Similalry to EODOC in Vienna, a Marine Data Centre for Sentinel-3 data is being installed at EUMETSAT. The European Organisation for the Exploitation of Meteorological Satellites already is involved in a number of activities connected to Sentinel-3 mission such as the planning of the joint operation of the mission and its services, the preparation of the ground station and data processing or the support and development of the launch itself. As an Marine Data Centre EUMETSAT is going to assume a similar role for marine satellite data as the EODC at TU Vienna for land surface data.
The Sentinel-3 mission’s main objective is to measure sea-surface topography, sea- and land-surface temperature and ocean- and land-surface colour with high-end accuracy and reliability in support of ocean forecasting systems, and for environmental and climate monitoring.
PALEOGEO
A number of presentation and posters brought up environmental issues from ancient epochs. PaleoGeo is an interactive map of paleoenvironmental studies on the entire globe. The information is provided in several subcategories such as paleobiology, paleooceanography, paleoclimatology, etc. The user is able to retrieve all necessary literature information on each study.
ORASIS coastal video monitoring
Beach topographic and hydrodynamic measurements are essential for coastal geology and engineering studies as well as sustainable coastal management. Standard approaches involve either time-consuming manual data acquisition usually with limited coverage or remote sensing techniques which are usually characterized by low resolution or increased costs.
The ORASIS project applies video techniques in order to monitor coastal areas. A Coastal Video Monitoring system typically consists of one or more video cameras, connected to a computer acquiring coastal imagery 10 min every hour during daylight, with an acquisition frequency of 1-4 Hz. Images are processed to generate the system’s ‘basic products’. i.e. time-averaged, variance, snapshot and timestack images, which are all projected in geographic coordinates using standard photogrammetric techniques. Following, a set of post-processing tools allows monitoring the intertidal topography, nearshore bar and shoreline position, as well as swash motions, on a daily basis.
The project was developed by Michalis I. Vousdoukas, researcher at JRC, ISPRA Italy.
More information on ORASIS and on researcher Mr. Vousdoukas.
![]()