How to create a reliable forest inventory using Earth Observation data

Editor’s note: This article was written as part of EO Hub – a journalistic collaboration between UP42 and Geoawesomeness. Created for policymakers, decision-makers, geospatial experts and enthusiasts alike, EO Hub is a key resource for anyone trying to understand how Earth observation is transforming our world. Read more about EO Hub here.
Forests are an essential part of our planet, without which life on Earth would not exist. They are responsible for filtering the water we drink, purifying the air we breathe, preventing erosion, and importantly, slowing climate change. They provide people with critical natural resources from wood to food and shelter for animals around the world.
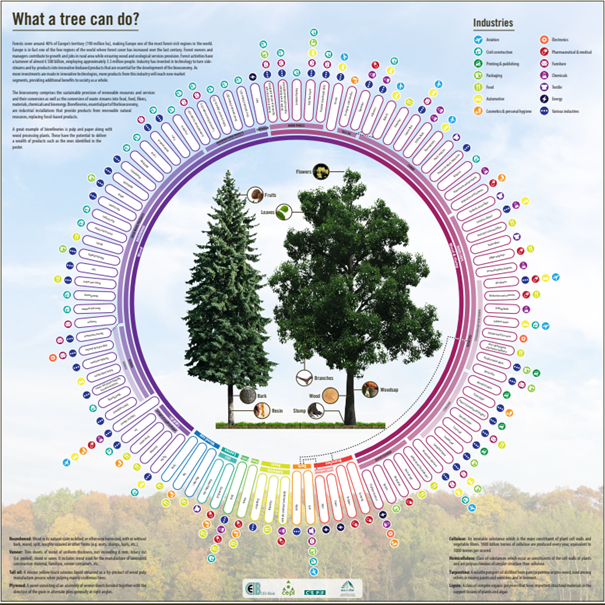
What a tree can do (Source: CEPI)
The forestry industry is a very important contributor to the national economies of many countries. It provides a multitude of different products including food, fuel, construction materials, medicines and raw materials for further processing. One of the main challenges in forest management is resource sustainability. In 1992, as a result of the UN’s introduction of the Forest Principles at the Conference on Environment and Development in Rio de Janeiro, many companies made changes to their forest management practices. The document called on member countries to promote forestry practices that “meet the social, economic, ecological, cultural and spiritual needs of present and future generations.” Forest companies are facing increasing risks, which can be effectively minimized by ensuring forest biodiversity, facilitating healthy ecosystems, and maintaining and preserving clean soil and water resources. The main threats caused by environmental change include:
– Wildfires
Climate change, land use and land management are affecting the occurrence and severity of wildland fires in many parts of the world.
– Insect Outbreaks
An increase in the frequency and severity of insect outbreaks is leading to the loss of significant forest areas around the world.
– Extreme events
A consequence of climate change is extreme events, which include increasingly frequent extreme winds. It is this, combined with drought, that leads to severe weakening of some tree species, which are then attacked by harmful insects and mold, and die completely.
Overview of core technologies
Traditional management and monitoring of large forests are both time-consuming, labor-intensive and expensive. That’s why new technologies for forest analysis, such as satellites and LIDAR, have begun to be used in recent years. The data acquired using these methods are different, but both technologies offer valuable new data not previously available to forest owners.
LiDAR uses laser light to survey the earth’s surface. The main advantage of this technology is its ability to penetrate the tree canopy, and map individual trees and the ground beneath them. In addition, it can provide highly detailed and accurate results. However, LiDAR has some key drawbacks. The data collection is typically done using airborne technologies, which are labor-intensive and use specialized equipment and aircraft, and also very expensive. Therefore, data updates are infrequent and sometimes take up to several years, potentially resulting in data that may be outdated.
Satellites, on the other hand, provide optical as well as radar data on the characteristics of entire forests. The data refresh rates are much higher compared to LiDAR. Such efficient monitoring allows for a much faster response to events, and also for temporal analysis – monitoring changes over time. The data is, however, mainly limited to what is visible on the top of the forest canopy. Forestry companies are seeing advantages of combining optical and radar data in a wide range of applications, which allows them to observe the effects of extreme weather events and fires, and also time to resolve tree health problems.
To effectively plan and manage forests, there is a need for solutions that provide detailed information on the topics mentioned above. “Access to highly accurate estimates of forest stand structure and composition is fundamental to ensure forest managers can plan and manage forest landscapes sustainably over time and space,” said Bruce MacArthur, President and CEO of remote sensing and forestry industry leader at Tesera in an interview with UP42.
Forestry use cases
Forest inventories enable forest owners and managers to operate and plan in a sustainable and profitable manner. Investment in silviculture requires reliable stand-level data to optimize and maximize growth and, over time, value. Emerging services such as ecosystem services, mitigation banking, and carbon sequestration require high-resolution information to inventory forests, support conservation efforts, and contribute to sustainable development. “There is a need for higher resolution forest inventory data and easier to use forestry solutions which is why we created our suite of High-Resolution Inventory Solutions (HRIS) to help move the forestry industry forward” says Bruce.
Satellites in geostationary orbit provide imaging of fires every 5 to 15 minutes. The equipment records the full impact of fires, from quickly detecting actively burning fires, to tracking smoke transport, providing information for fire management, and mapping the extent of ecosystem changes. Changes can be mapped days, and even decades, after a fire. In addition, locations of new fire outbreaks can be sent directly to land managers around the world.
Typically, foresters must obtain each piece of information from a separate source. That’s why intermediary data companies work well in this case. One of these platforms is UP42, which has started a partnership with Tesera. The partnership will allow forestry customers to quickly and comprehensively acquire specialized data from a single platform: “We have found that satellite data and other remote sensing and geospatial data are really spread out across a number of providers and platforms, all with different degrees of difficulty to obtain and stream into analytics processes. What we really like about what UP42 has done is putting these big datasets into one place with common building blocks to interface with the data for our use cases.” – says Bruce
Another challenge for forestry is related to parasites, particularly the bark beetle, which is a plague on trees in continental regions. Some of the most popular indicators for controlling this pest are the Normalized Differential Vegetation Index (NDVI) and the Moisture Difference Index (EWDI). With these, foresters can easily determine the area where diseased or dead trees are present. To enable quick and efficient forest management, applications with algorithms for automatic classification of forest areas are increasingly being developed to support the forest industry in tasks such as tree inventory. The data is automatically analyzed by the system, and a report then provides information, for example, on the number of trees and their parameters in a selected area.
However, earth observation data is not just about satellites and aircraft. Drones are increasingly being used to acquire highly accurate data. These, combined with artificial intelligence, enable appropriate measures to be taken to protect forests by inventorying them, detecting pests, determining the condition of trees and calculating the areas affected by natural disasters. Thanks to the use of such technology, it is possible to collect data from the hardest-to-reach places.
Earth observation data are also an invaluable aid in high winds. An analysis of forest damage was carried out by Piotr Wężyk from the University of Agriculture in Krakow after the hurricane that took place in the Piska Forest in 2006. The mapping of damaged stands consisted of developing CIR aerial photos and interpreting the damage. The thematic maps that were created were then used to conduct GIS spatial analysis to determine the extent of the damage. Thanks to the continuous development of technology, we no longer have to do all the work separately. The UP42 platform features the Land Lines application, in which an algorithm scans remote sensing images for natural loss. With such platforms providing comprehensive data, forest management using new technologies is available to anyone interested.
“Land Lines application” (Source: TESERA)
Conclusions
The forestry industry, despite numerous threats, has the opportunity to draw the best possible data needed for forest inventories. Thanks to advances in technology, these opportunities are available to all interested customers. As Bruce MacArthur summarized on The Digital Forester podcast: “The quantum change that happened is the fact that people now can use these technologies in innovative ways that were previously limited to top researchers, but now with advanced computing, cloud processing, machine learning and remote sensing, it enables companies to be able to take advantage of them in unique ways that help our clients in ways that were not possible previously.”
Did you like the article? Read more and subscribe to our monthly newsletter!

#Data source


Next article
How can remote sensing data be used to track plastic in the ocean?

Editor’s note: This article was written as part of EO Hub – a journalistic collaboration between UP42 and Geoawesomeness. Created for policymakers, decision-makers, geospatial experts and enthusiasts alike, EO Hub is a key resource for anyone trying to understand how Earth observation is transforming our world. Read more about EO Hub here.
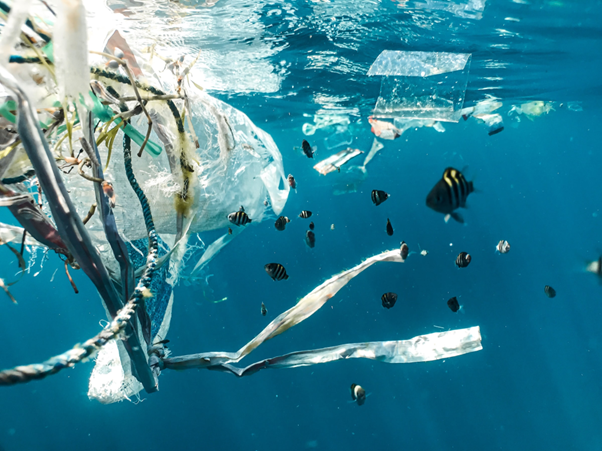
Around 10 million tonnes of plastic gets dumped into the oceans every year. The problem has gotten so bad that dumped plastics can be found in all parts of the ocean, from the equator to the poles and even frozen into polar ice. Vast ‘gyres’ of plastics exist in the Indian, Atlantic, and Pacific oceans. Two such gyres are so enormous that they have gained the name of the Great Pacific Garbage Patch. Smaller seas such as the Mediterranean and the North Seas are also developing their own garbage patches.
These garbage patches are not solid. They are simply enormous concentrations of plastic marine litter focused in one particular area.
Plastic cannot biodegrade. It breaks down into smaller and smaller pieces called microplastics. In the Great Pacific Garbage Patch — which stretches anywhere from a few centimetres to a few metres under the surface of the water — these microplastics make the water look like a thick soup.
Microplastics are ingested by marine life and eventually enter the global food chain. The long-term consequences of this to marine life and our own health are as yet unknown.
The problem with cleaning up this plastic is twofold:
- Until recently, nobody really knew just how much plastic was floating in the oceans.
- Lacking efficient reconnaissance techniques to determine the highest concentrations of plastics means that cleanup efforts are inefficient and overly costly for the amount of plastic recovered.
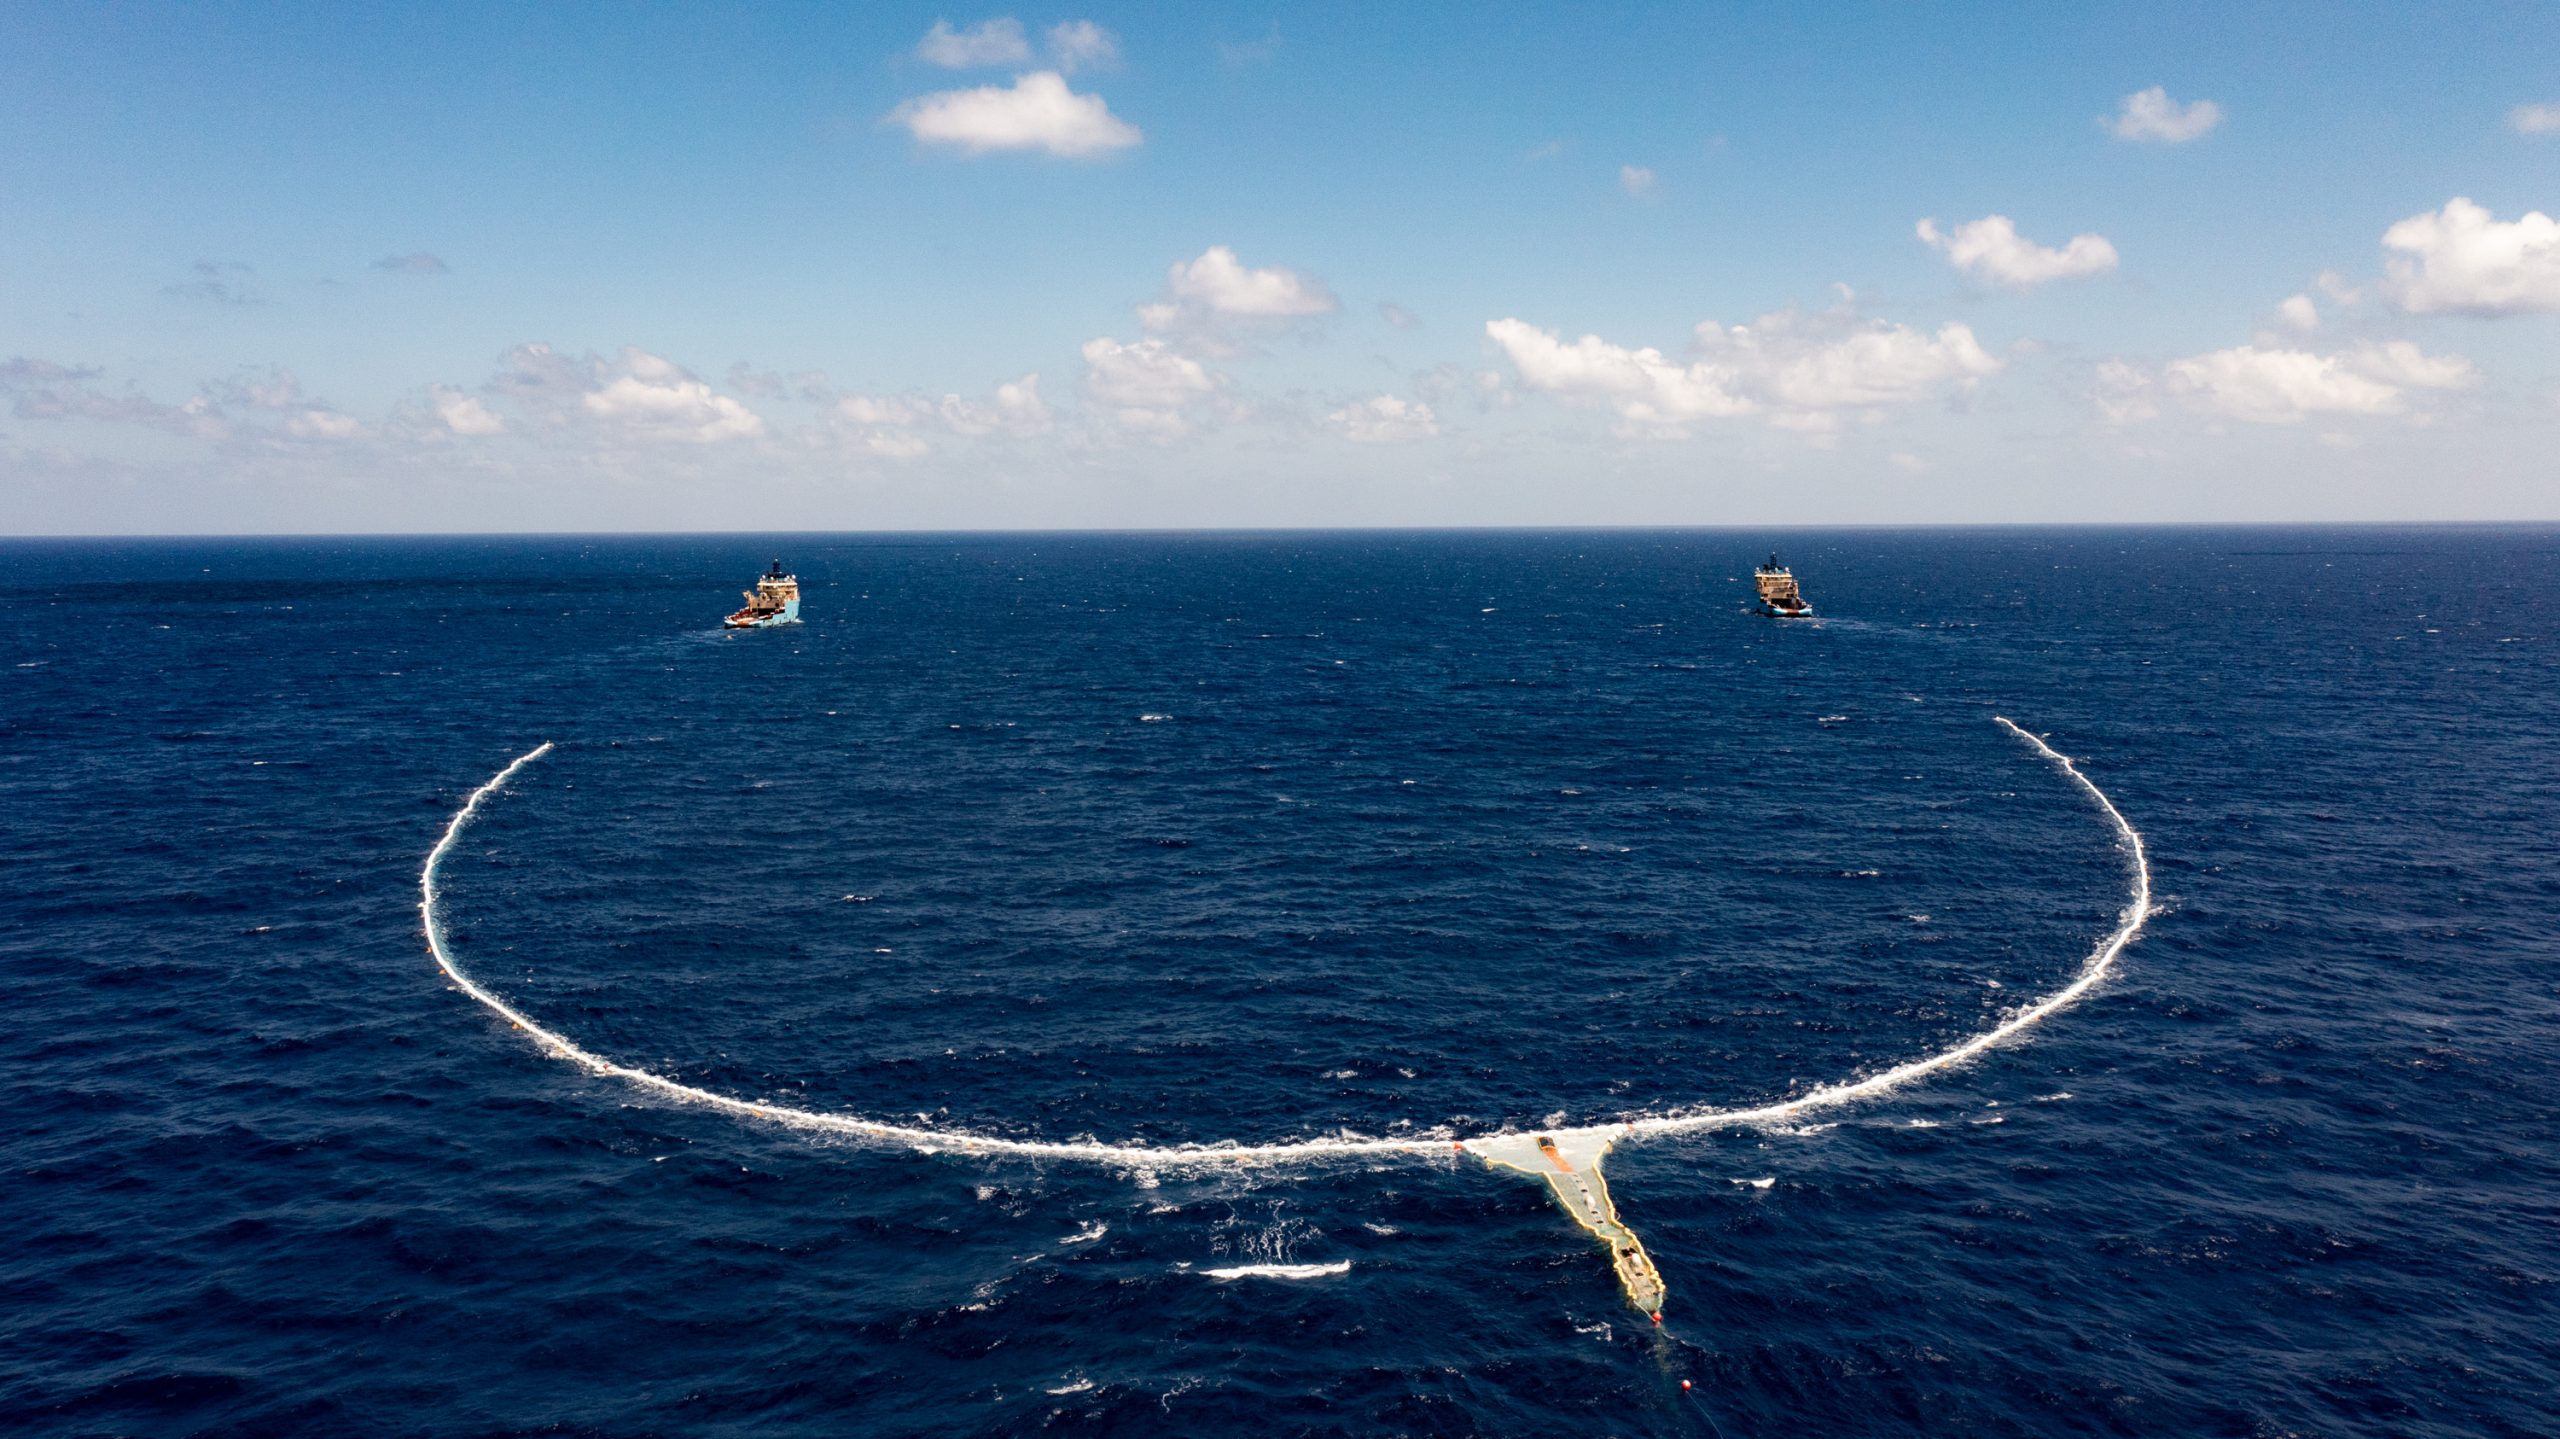
The Ocean Cleanup is a Netherlands-based non-profit organisation founded and led by Boyan Slat with the purpose of developing technology to clean up our oceans. What they have learned is that to clean the plastic, you need to learn to locate it effectively.
How The Ocean Cleanup moved to using Earth Observation data
Back in 2014, no one really knew how much plastic debris was floating around in the oceans. Numbers between tens of thousands and tens of millions of tonnes of plastic were floated. To understand the scale of the problem, The Ocean Cleanup needed to get an accurate figure of how much plastic there was to be cleaned up.
Todetermine the amount of plastic, The Ocean Cleanup launched something called the Mega Expedition. “We crossed the ocean with 30 boats at the same time, taking more measurements in three weeks than in the preceding 40 years combined,” said one of the non-profit’s representatives.
The team discovered that there was debris that was even larger than what they were able to properly sample. So they launched yet another unprecedented expedition, this time using a Vietnam War Era C-130 Hercules aircraft to spot large debris and determine how much of it was in the ocean.
The results from both expeditions were alarming. About 80 million kg of plastic spanned an area that was three times the size of continental France. Of all that garbage, 92% of the mass is still contained in larger objects (>5mm).
“In just two-and-a-half hours, our crew observed more than a thousand large objects of plastic floating underneath this aircraft,” said Boyan Slat.
By focusing on collections of large objects, the team can prevent the breakdown of these objects into microplastics that can enter the food system over the next few decades.
Plastic detection from space
But aerial mapping using aircraft was simply too costly to be done on a large scale. Satellite data seemed the logical option, but there were several challenges involved:
In 2017, the organisation teamed up with ESA, Airbus — the same company that provides VHR satellite data through the UP42 marketplace — and various other spatial organisations to investigate the potentials of making “remote sensing a reliable, scalable and efficient source of data for marine debris.” The project was called RESMALI — Remote Sensing of Marine Litter.
The intent was to create a SWIR (Short Wave Infrared) spectral signature library for oceanborne plastics. The challenge with such a library comes in the form of biofouling — the accumulation of bacteria and other marine organisms — as well as the plastic’s brightness. Both of these factors can affect the reliability of the spectral signature.
The other factor was the power of the satellite. To make such hyperspectral observation work, the satellite camera must have an extremely high ground sample distance (GSD). At the time, the best commercial satellites provided grayscale imagery in VHR at a GSD of 30 cm/pixel. The purpose of RESMALI was to determine what GSD was required to accurately detect plastics in the ocean.
It was discovered that, to detect objects of 1 m2 (these occurred roughly every 1 km2), they needed a hyperspectral camera with a GSD of 10 m/pixel. Satellites of this capability still are not commercially available.
But the project set in motion follow-up projects to find better ways to detect plastics in the ocean. For example, following up on the RESMALI project, ESA launched the SPOTS (Spectral Properties of submerged and biofouled marine plastic litter) project to further investigate the effects of biofouling and water depth on spectral reflectance.
Ghost nets
Waiting for the technology to be developed for a higher GSD was not an option. The team needed to find ways to determine the location of the highest concentration of plastic debris right now, using existing technology. The subject of ghost nets offered one possible solution.
Ghost nets are discarded fishing nets. Sea life can get trapped inside them, but they also indicate the presence of plastic around them.
The Ocean Cleanup developed several algorithms to detect ghost nets on the ocean’s surface and teamed up with Airbus to utilise satellite tasking to find these ghost nets.
To make this happen, The Ocean Cleanup required information on moving objects in less than 24 hours. Using the VHR Pléiades satellite developed by Airbus, The Ocean Cleanup Research Centre is able to order and receive tasking within 16 hours. Even during 56% cloud cover, the combination of rapid tasking and The Ocean Cleanup’s algorithms were still able to detect 10 ghost nets on 19 October 2018, the date they evaluated the system.
By determining the position of the ghost nets, The Cleanup Project is able to optimise its removal operations to focus on areas of highest concentration.
Conclusions
With at least 24.4 trillion pieces of microplastics estimated to be in the oceans, effectively cleaning up large oceanborne debris has never been more vital.
Using optical satellite data to map the position of plastic debris is challenging because only extremely large debris would be visible. Hyperspectral data, based on a dataset of spectral signatures, looks promising but it requires satellites with a high GSD that don’t currently exist for public usage.
The Ocean Cleanup is not giving up. And its efforts have spurred interest and innovation within the industry, giving rise to multiple projects across different technologies, each with the aim of finding ways to accurately map the position of these plastics so that cleanup efforts can be organised for maximum efficiency.
The Ocean Cleanup itself is testing another method of detecting marine debris — this time installing cameras with GNSS systems on vessels, and then using Deep Learning to detect floating objects in the ocean.
Breakthroughs in satellite technology and a better understanding of how to remotely sense plastic debris in the oceans are opening doors to more efficiently remove this plastic from our waters. And the quick availability of satellite data and computing algorithms via platforms such as UP42 makes it possible to conduct research more easily.