How satellite data is used to understand sea level rise

Editor’s note: This article was written as part of EO Hub – a journalistic collaboration between UP42 and Geoawesomeness. Created for policymakers, decision-makers, geospatial experts and enthusiasts alike, EO Hub is a key resource for anyone trying to understand how Earth observation is transforming our world. Read more about EO Hub here.
Unfortunately, the world’s sea level is constantly rising. This is not due to a single cause, but is influenced by many factors, including intense consumption of stored water. Factors such as loss of wetlands and deforestation are crucial to the sustained flow of water into the oceans from constructed artificial reservoirs. As an example, let’s consider the situation in the Aral Sea region. Water consumption in agriculture is so high that it has lowered the level of stored water in reservoirs, consistently raising the sea level. Changes in land movement caused by the subsidence of the earth’s crust are also a contributing factor. Rising tectonic plates will also inevitably raise the sea level. However, this process occurs on large time scales and is very slow. Scientists surveying areas in Florida have estimated that the land near coastlines has been rising at a rate of 0.02 to 0.05 mm per year over the past 1.6 million years.
There is no doubt that the main reason for rising sea levels is the warming of the oceans caused by climate change. As water molecules absorb heat, they increase in size (thermal expansion) and eventually cause the oceans themselves to become larger, and sea levels to rise. Another effect of global warming is the melting of glaciers, which return water to seas and oceans, thus leading to their expansion. Scientists are now carefully studying the ice caps, and estimate that melting ice contributes 0.35 mm per year to rising sea levels. To better show the scale, it is worth mentioning that if the ice caps melted completely, the level of the oceans would rise by about five meters from the West Antarctic ice sheet, 7 meters from the Greenland ice sheet, and 53 meters from the East Antarctic ice sheet!
Satellites have been recording the height of the ocean surface since 1992. Since then, according to NASA, the average sea level has risen by 10.1 cm. In addition, the rate of the increase in the sea level continues to rise. In the 20th century the sea level increased by 1.5 mm per year; in the early 1990s it was 2.5 mm per year, but in the last decade it has accelerated to as much as 3.9 mm per year! According to NASA, every 2.5 cm rise in sea level results in the loss of 2.5 m of coastline.
Unfortunately, a 30-year study shows just how much man is to blame for this situation. In the words of Josh Willis, a NASA oceanographer, “Sea level rise caused by human interference with climate is now eclipsing natural cycles… and it’s happening faster and faster every decade.” The truth is that the human impact is 10 times greater than the natural rise in sea level, and much depends on us. The Intergovernmental Panel on Climate Change predicts that sea levels could rise by as much as 1.1 meters by the end of this century.
The chart below shows the upward trend of global average sea levels and future projections.
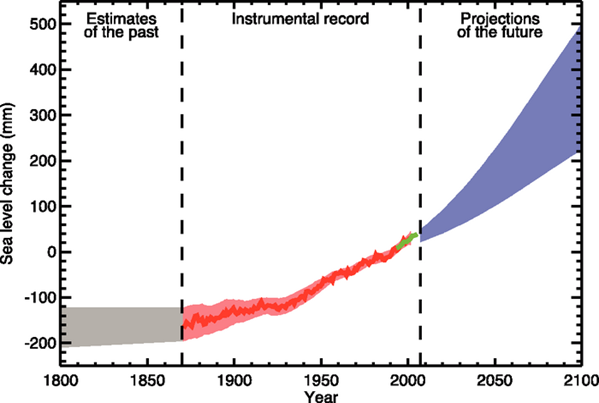
Time series of global mean sea level in the past and future. Source: Intergovernmental Panel on Climate Change (IPCC)
If we consider the history of our planet, we can see that the sea level has risen and fallen many times in the past. The cause was mainly natural processes, tectonic movements and climate warming. However, the stakes have never been so high, and the Earth has never been so heavily populated.
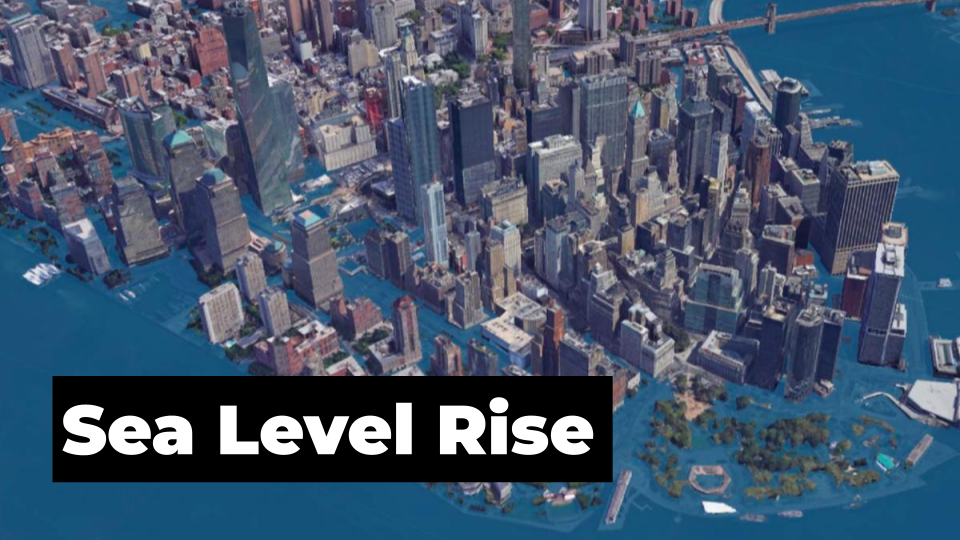
Rising sea levels are already having catastrophic consequences. We can see these with the naked eye by looking at coastal flooding and shrinking beaches. Some countries, such as Bangladesh, are losing crop species due to sea water polluted land. For coastal communities, the situation poses a danger in the form of erosion, storms and flooding.
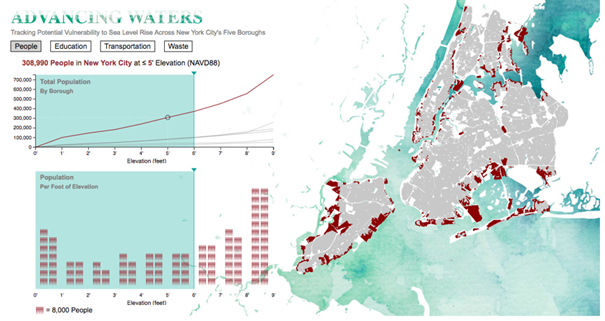
In addition, many major megacities, home to billions of people, are located right on the coast. Shanghai, New York and London are just some examples of heavily urbanized cities that are potentially at risk. The example of an interactive visualization by Landscape Metrics illustrates what this means for a city’s residents and infrastructure.
The situation poses an even greater risk to smaller islands, where people have limited space to relocate. The main center of life is located on the coast, where flooding equals a major disaster.
Satellite data forecasts a warning scenario
It is an indisputable fact that there is no better method to observe the big blue ocean than through satellites orbiting the earth. Water covers 70% of our planet, and getting the same information at the same time from the surface is impossible. With satellite data, we can see the extent of changes over time, and we can thus prepare for the effects. Maps and analyses generated from satellite images make it clear how serious the problem of rising water levels is, and how quickly we can feel the consequences. The changes are happening right now, and it is necessary to take action to minimize the potential damage.
Surging Seas Global Risk Zone Map
The predicted breakup of the ice caps will lead to at least a meter of acceleration in global sea level rise over the next two centuries, and at least a three-meter rise at the end. Ever wondered what your city will look like in such a scenario? Climate Central has created a Surging Seas Global Risk Zone Map that allows you to study the risk of flooding up to 30 meters along the world’s coasts. The map can be searched by city, state, zip code and other location criteria. For areas of the United States, the map includes the latest high-accuracy, high-resolution LiDAR data provided by NOAA. In addition, the layers include information showing social vulnerability and population density. However, for areas outside the United States, altitude data from NASA’s Shuttle Radar Topography Mission (SRTM) was used. The visualizations presented in the app provide thought-provoking insights, which help us better understand the impact of rising water levels on our lives.
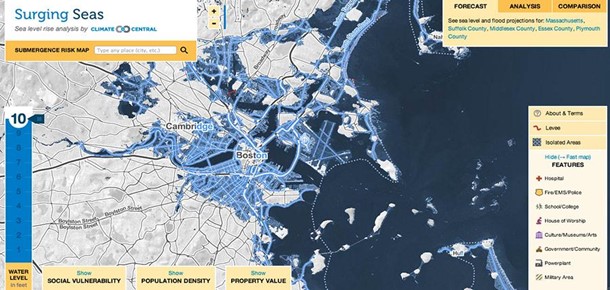
Boston projections showing water level 3 meters above the high tide line; Source: https://riskfinder.climatecentral.org/
Vulnerability to sea level rise in the tropics
According to a recent article published in Nature Communications, 267 million people live on land less than two meters above sea level. The study used a remote sensing method called LiDAR, which uses light in the form of a pulsed laser to measure the distance to an object. These light pulses, combined with other data recorded by the system, generate precise, three-dimensional information about the studied object’s shape. Based on the results, the researchers predicted that, if the rise in sea level is one meter and the population remains the same, then by 2100 the number of people at risk will increase by more than 140 million! According to the maps presented in the article, 62% of the most vulnerable land is located in the tropics. Unfortunately, the forecasts are not optimistic and assume that 59% of the population is at risk in tropical Asia, and as much as 72% in the tropics!
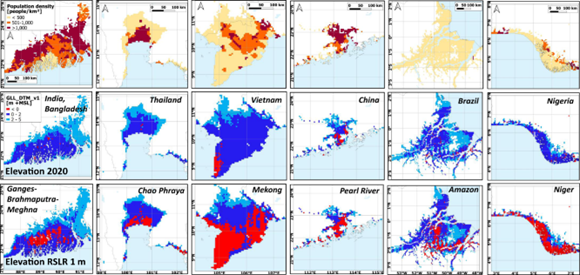
(Top) Population in 2020 (middle) land surface elevation in 2020 (bottom) land surface elevation after 1 m relative sea-level rise (RSLR); Source: Hooijer, A., Vernimmen, R. Global LiDAR land elevation data reveal greatest sea-level rise vulnerability in the tropics.
But with measurable data, more parts of the world can better plan for rising seas, and take thoughtful steps to protect disaster-prone areas. According to Dr. Aljosji Hooijer, lead author of the study, “As long as there’s not really good data on the table, you cannot have a proper discussion about that, but nowadays, data is there, and the accuracy is much higher.” LiDAR technology has theoretically existed since the 1960s, but has evolved considerably in recent years, and survey results are much more accurate. Hooijer was able to use terrain elevation measurements around the world with a much smaller margin of error. Today, data and processing functions are accessible to everyone on geospatial platforms such as UP42. Technology, data quality and the geospatial market are constantly evolving, which allows for even more investigative research.
The Baltic SEAL
The usefulness of satellite data in better understanding the changes taking place is also confirmed by an ESA project called the Baltic SEAL. A group of scientists from the Technical University of Munich, in cooperation with partners from around the world, set out to develop algorithms to work with data on water level changes.
The researchers chose the Baltic Sea as a model region for the study. “Data from this region works exceptionally well for developing new methods to analyze them, because many factors – such as the winding coastline, sea surface ice and wind – make analysis complicated. In addition, there are many local sea level measurements needed to confirm the results,” said Marcello Passaro, project lead. “The method that works for the Baltic Sea will be easily adaptable for other regions.”
With the availability of the aforementioned algorithms, it will be possible to plan a preventive strategy in the event that parts of the coast are inundated. The new way of processing satellite data will make it possible to determine sea levels by the millimeter each year. In the current situation, if the water level continues to rise at such a rapid pace, the information obtained in advance will provide a valuable guide for decision-making bodies in planning and taking action.
Conclusions
Thus, as can be seen from the Baltic Sea, as well as other examples, satellite data has a number of applications related to rising sea levels. With the use of advanced algorithms and LiDAR data, we can track sea and ocean levels. Consequently, what we know is the scale of threats and where potential threats may occur. In addition, awareness of the situation allows for early warning and preventive action based on advanced models created using satellite data. This provides us with an awareness of the problem, shows how the map of threats is spread, and how we should react and cooperate in a possible response.
Without the use of specialized instruments, it is not possible to accurately and quickly investigate the phenomenon described. Even if we fail to stop the rise of ocean waters, we will be prepared for the possible consequences. This is what precise and reliable satellite data enables.
Did you like the article? Read more and subscribe to our monthly newsletter!

#Data type

Next article
How Satellite Data is Contributing to Global Food Security
Editor’s note: This article was written as part of EO Hub – a journalistic collaboration between UP42 and Geoawesomeness. Created for policymakers, decision-makers, geospatial experts and enthusiasts alike, EO Hub is a key resource for anyone trying to understand how Earth observation is transforming our world. Read more about EO Hub here.
One in 10 people go to bed hungry each night, according to data from the UN’s World Food Programme. Globally, enough food is produced to feed every person on earth, but despite this, up to 811 million don’t have enough to eat. The number who can’t afford a healthy and nutritious diet is even more staggering: 3.1 billion, almost half the world’s population.
The situation is exacerbated by climate change, geopolitical tensions, and massive supply chain disruptions due to the COVID-19 pandemic—all of which tend to hit developing countries the hardest. The restrictions imposed by pandemic-driven lockdowns and travel bans, for example, were felt most strongly by low-income households, which simultaneously lost the ability to access markets as well as their own livelihoods.
In an episode of the Minds Behind Maps podcast on Food Security in Africa, Dr Catherine Nakalembe, Program Head of NASA Harvest Africa, makes the crucial point that access to food means both that the food is available and that it is not overpriced. “If there’s food at Whole Foods but I can’t buy it because it’s so expensive,” she explains, “I don’t have access to it.”
A new tool to support Global Food Security
Thankfully, technology is providing solutions to the food security crisis, and one of the most promising tools is remote sensing.
In fact, satellite data and advanced geospatial analytics have been used by various development institutions for some time. One of them is the World Food Programme (WFP), which is the world’s largest humanitarian agency, and one of the most advanced when it comes to using remote sensing in its operations. The agency and its local teams use both satellite and drone data, and it even has a dedicated task force—called Vulnerability Analysis and Mapping (VAM)—running the analysis.
The key focus for WFP’s local teams and the VAM platform is the use of Earth Observation data to monitor the impact of natural disasters, armed and political conflicts, extreme weather events, and other factors affecting agricultural production. They do this while also monitoring global and regional production levels to predict where problems may occur, enabling them to prepare accordingly. According to Dr Nakalembe, “Agricultural production is where remote sensing has a huge contribution.”
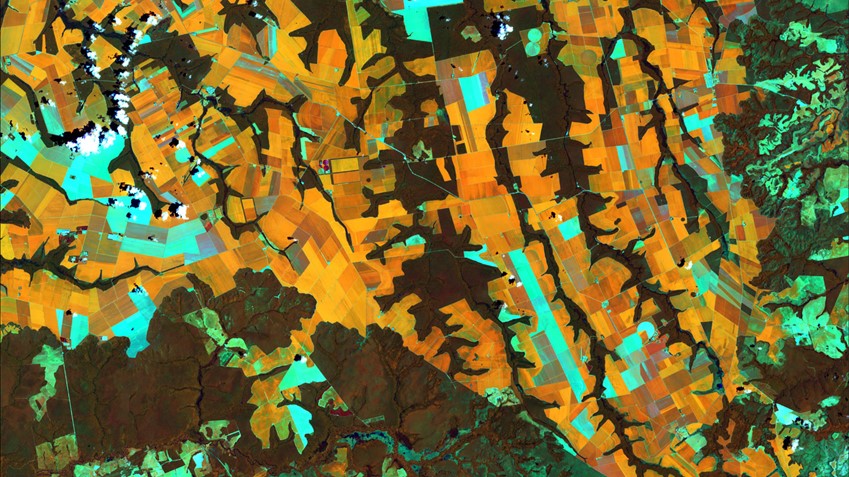
Satellite image of soy fields. source: https://www.cofcointernational.com/stories/satellite-images-play-major-role-in-building-sustainable-soy-supply-chain/
There are dozens of applications for remote sensing data when it comes to improving food security, from yield prediction to identifying environmental ‘hotspots’ or potential disaster areas.
The WFP uses different types of satellites to serve very specific purposes, with RGB imagery and multispectral data playing important roles. However, the most significant variable dictating which data will be applied to a specific use case is spatial resolution. Depending on that resolution, data can be used to provide a clear picture of various factors that could affect agricultural production or a disaster related risk in a particular area.
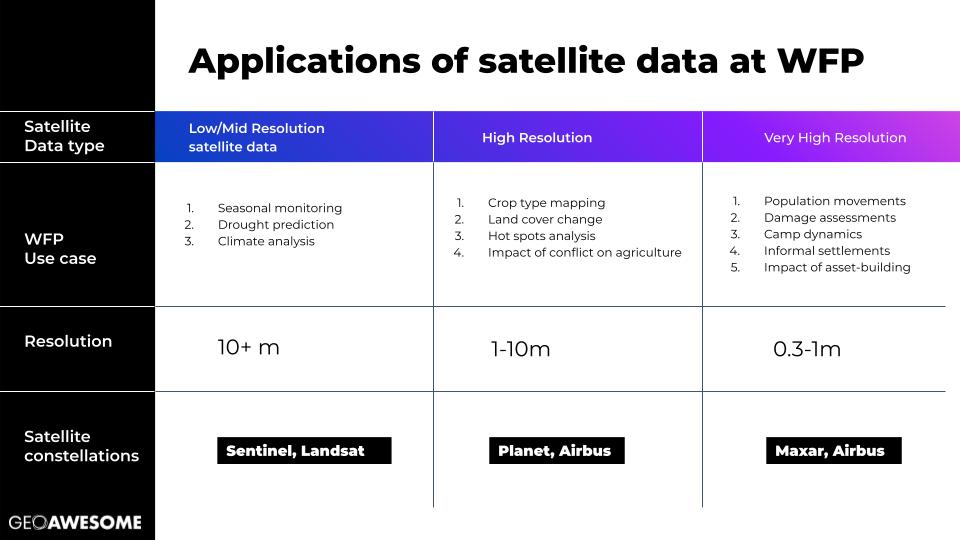
Applications of low–medium, high, and very high resolution satellite data
High-resolution data (between 1–10m) allows for detailed monitoring of changes to land use, crop type, and other hotspots, and is available from the Planet and Airbus constellations. Very high resolution imagery (below 1m), from Maxar and Airbus, can inform on population movement, settlements, infrastructure, and more.
Although many applications do require imagery at a high or very high resolution, the lower resolution, open-source data (from Sentinel and Landsat) can still be a powerful tool for providing a periodic overview of large areas of land or predicting climate conditions such as drought.
Seasonal Monitoring and Drought Prediction
One of the key applications of this type of climate data for the WFP is in its ‘Seasonal Monitor’, which analyzes the latest satellite data streams and seasonal forecasts to identify any developments that might be of humanitarian concern.
One of the most devastating factors when it comes to crop performance and yields is a prolonged period of drought. Early prediction of drought is therefore vital for the WFP and other organizations focused on food security, to help them anticipate how crops will perform throughout the current growing season and in future years.
In rural and impoverished areas, traditional methods of drought prediction are used, which usually comes down to in-situ physical rain gauges. These can be impractical, unreliable, and they only provide a relatively short-term forecast. Furthermore, all too often there simply aren’t enough of them—it’s easy to misinterpret data from a few isolated rainfall stations.
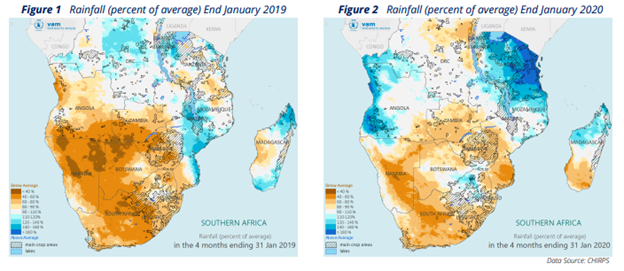
WFP uses data from CHIRPS (Climate Hazards Group InfraRed Precipitation with Station data) which combines information from local rain gauges with infra-red satellite data:
An even better early predictor of drought is to measure soil moisture, and it is now possible to do this from space. EUMETSAT’s Metop satellite carries an ‘Advanced Scatterometer’, which emits microwaves capable of penetrating several centimeters into the ground, where water molecules have the effect of ‘scattering’ the waves. The strength of the signal corresponds to the amount of water in the soil.
Satellite data provides better coverage, is more reliable, and gives more warning about impending drought than local gauges. The power of the technology is demonstrated by this chart of soil moisture levels in the Western Cape of South Africa, which clearly shows the strikingly dry conditions during 2017 compared with previous years:
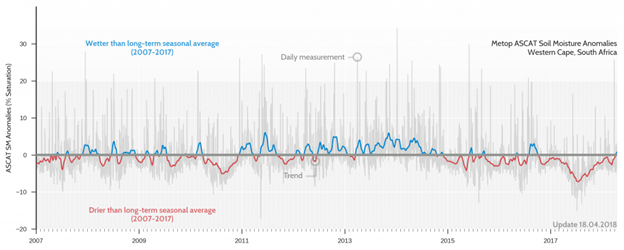
Soil moisture anomalies in Western Cape, SA — https://www.eumetsat.int/features/how-satellites-can-help-detect-impending-droughts
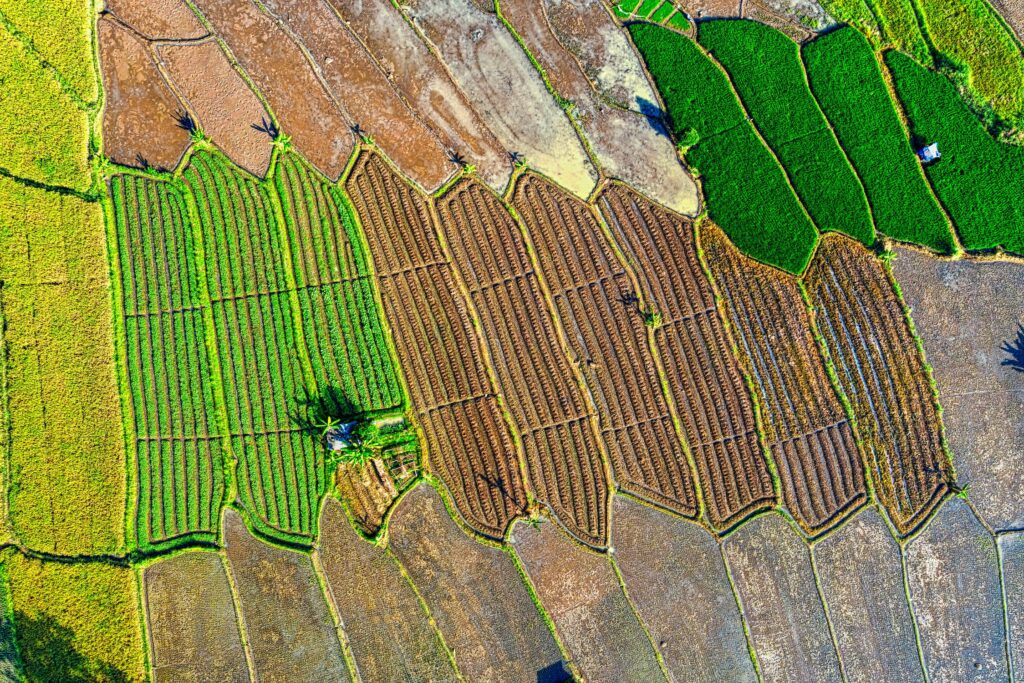
Remote Monitoring of Agricultural Production
To manage food security, it is vital that the WFP is first able to monitor agricultural production. By performing spectral analysis on satellite imagery, the organization is able to identify crops, assess growth, and predict eventual yields at harvest time. This method works by tracking the reflectance of the crop canopy throughout the growing season and using vegetation indices like NDVI to assess chlorophyll content—and it requires high-resolution data.
Satellite-based yield prediction has proven to be far more reliable than traditional methods in giving an accurate and early prediction of eventual yield, and is becoming increasingly relevant in managing food security. By mapping this data, the WFP (as well as other companies and organizations) can accurately forecast grain supplies and make contingency plans.
Specific information on crop health can also be combined with other data sources to provide further insights regarding agricultural production in specific areas. The data can help in terms of preparing crop rotation plans, mapping soil productivity, assessing crop damage, and more. In fact, one of the most important applications for the WFP is providing evidence to advocate for humanitarian intervention.
Recently, another UN body, the Commission on Science and Technology for Development (CSTD), partnered with China to make their ‘CropWatch’ system available to developing countries battling food insecurity. The international program will give developing countries the agency to monitor their own crops in real-time, as well as providing an infrastructure platform to enable them to analyze this data. The primary aim is to increase national food security, but the system can also be customized to meet the specific needs of individual countries, including achieving SDGs.
Beyond Crop and Climate Monitoring
Monitoring crop performance and climate conditions may be the most obvious applications for remote sensing and food security, but development institutions like the WFP are finding many more uses for satellite data.
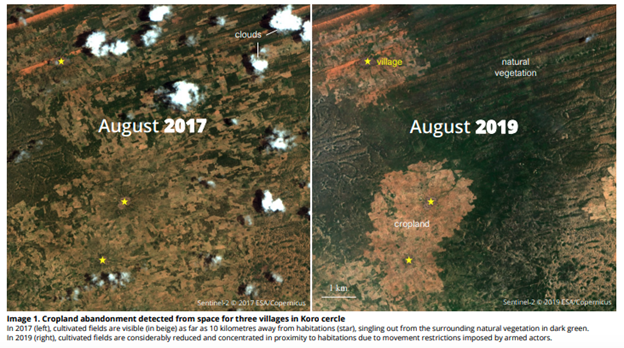
For instance, very high resolution data can be useful in monitoring ‘hot spots’: large-scale environmental changes, whether positive or negative, which might have an impact on agricultural production. These are often caused by human activities, including population movement, informal settlements, and armed conflicts. Satellite imagery can be used to detect such hot spots and determine any changes that will specifically affect agriculture—for example, diversion of water sources or changes in land use.
Through very high resolution imagery, sufficient data can be gathered for organizations to make accurate predictions on what impact these situations might have on food production, whether any intervention is required, and whether food shortages are likely. For example, in 2019, the WFP was able to use satellite data to detect and measure abandonment of cropland in Mali:
Other development institutions are increasingly turning to satellite data to inform and facilitate their activities, including infrastructure projects. For example, in 2016, Germany-based development bank KfW began financing the construction of an irrigation perimeter for the purpose of improving food security in Niger. The result was the creation of an area of wetlands which effectively tripled rice yield for around 8,000 smallholder farmers, each of whom supports a family of around 10 people, meaning 80,000 people have improved living conditions as a result of the improved irrigation.
However, in 2020, flash floods occurred across Niger, and there was a pressing need to assess the extent of any damage caused to the infrastructure by the flooding. Due to the challenging local conditions, exacerbated by travel restrictions imposed during the pandemic, the only option for assessing the damage was to use remotely-sensed satellite imagery, so
Following this, satellite data became a more permanent solution for KfW’s infrastructure monitoring challenges. The company has now established a dedicated geospatial information service, which provides data that can verify the implementation of financed projects and monitor impact, as well as aiding in the selection of adequate project sites, and ensuring that appropriate safeguards are in place throughout implementation.
The Challenge: Access to Data and Machine Learning
Development institutions and food security programs face a big challenge when it comes to satellite data: Although access to data has improved significantly over time with the use of platforms such as UP42, there is still a deficit when it comes to high-resolution data—as well as the processing and analytics resources required to work with it.
Data of the highest resolution is particularly useful, explains Jean-Martin Bauer, the WFP’s country director for Haiti, partly because it can be used in conjunction with other sources of data, and can thereby provide insights more accurately and rapidly. Unfortunately, this type of high-quality data is not easily available, and as a result the WFP primarily resorts to using open data from Sentinel and Landsat. “With the private companies […] cost is still a barrier,” Bauer says. “That data is still behind a paywall.”
There is a similar issue when it comes to the AI and machine learning technologies that are needed for data analysis to be performed at scale. Currently, to monitor events like natural disasters and their impact on food security, the WFP extracts data manually from both satellite and mobile phone imagery. Conducting this process takes considerably longer for a human than it would take an AI.
“I’d love to see an Open AI movement, where the satellite data itself and the libraries could be totally open for humanitarian purposes,” Bauer says. However, “that space has to be designed so that the private companies do not lose their competitive advantage.”
What’s Next for Satellite Data and Global Food Security?
Earth Observation data is already a critical tool in the ongoing quest for global food security. It gives us the ability to view vast areas, including those out of reach by conventional methods. It provides rich, multispectral information that can’t be seen from the ground or with the human eye, and where archive satellite data is available, it even gives historical context to aid in understanding baselines and geospatial dynamics.
Soon, development organizations will be provided with even more tools to aid the fight against hunger. NASA has been leading the way with research projects to improve our understanding of agricultural methods, offering insights for long-term agricultural planning—and, consequently, food security. One of their projects is the Harvest program in Thailand, which aims to understand the effects of land use change on biomass emissions and soil quality. Specifically, it assesses the effects of crop type and management practices, and their impact on soil carbon levels and general rural wellbeing. The data produced by the project is expected to be used to inform land use and policy on a regional scale—however, the hope is that the methodology could be extended to other developing countries in South Asia.
Another NASA project aims to create a prototype Cropland Carbon Monitoring System to improve existing methods of estimating carbon flux—the process by which carbon is absorbed, stored, released or transferred through various agricultural processes—and its environmental impact.
Satellite data is helping to save millions of lives each year, by providing development institutions with the tools they need to increase food security. However, there are significant areas for improvement. In an ideal world, the WFP and other organizations need access to datasets from private companies, as well as the advanced AI models which permit advanced data analysis, to make the most of the technology available. If that can be achieved—and what companies like UP42 are doing is certainly a step in the right direction—then anything’s possible.
Did you like the article? Subscribe to our monthly Geoawesome Newsletter: