How Satellite Data is Bringing Value to Commodity Trading

Editor’s note: This article was written as part of EO Hub – a journalistic collaboration between UP42 and Geoawesomeness. Created for policymakers, decision makers, geospatial experts and enthusiasts alike, EO Hub is a key resource for anyone trying to understand how Earth observation is transforming our world. Read more about EO Hub here.
Commodity trading relates to the buying and selling of raw materials like oil, coal, metals, or agricultural products, amongst others. Success basically comes down to how accurately a speculator can predict supply and demand. To do this, investors need accurate and reliable information—and they need to have it before anyone else does.
This is where satellites come in. While the bulk of commodity trading involves investing in “futures contracts,” the commodities themselves are all physical assets and therefore have one thing in common: they have a physical footprint, which means they can be observed from the sky.
The use of Earth observation data is becoming increasingly important in commodities trading, providing investors with reliable and accurate information to inform their decision-making before markets are impacted. Although investors won’t base their decisions solely on satellite data, it can be an important tool in verifying market data with physical evidence, helping to detect anomalies or trends which can help identify significant investment opportunities and mitigate risks. The use of EO data is not replacing any existing process. It is another value-adding layer of information to forecasting models, which eventually help traders make better decisions.
Accessing and analyzing satellite data is easier than ever before
The number of satellites now in orbit—and, just as importantly, the quality of the data offered by public and private satellite programs—is getting to a level where we can observe any place on Earth multiple times a day. It can be done using optical satellites such as Pléiades Neo, which offers very high resolution imagery, or using SAR satellites, which can penetrate cloud coverage and provide data even at night.
In the past, the biggest challenge for those dealing with satellite data has been its price. However, with growing market competition, and online platforms such as UP42, the price of satellite data is becoming more transparent, and buying it—historically a challenge—is becoming more convenient. It’s now also easy for companies to task satellites to capture data for any Area of Interest. The data can then be used by organizations to assist in predictive models and forecasts, supporting a wide range of trading and investment activities.
This all means that asset management companies, stockbrokers, and commodity traders are able to access time-sensitive business intelligence long before markets are affected. By monitoring weather anomalies, supply chains, inventory levels, and production activity, data sets based on Earth Observation are making it easier for stakeholders to forecast supply and demand, and to evaluate risk.
Use cases for Earth observation in commodities trading
From a technical perspective, extracting business intelligence insights from Earth observation data is no more complicated than any other geospatial analysis. The same techniques are used, just in a different context. Basic algorithms include object counting, vegetation indexes, change detection, and volumetric measurements. These can be combined with more advanced image analytics algorithms and Deep Learning models.
Object counting
A principal use case of Earth observation is object detection and counting. This has multiple applications, but one of the best examples for business is car counting, which can indicate the traffic at retail locations, for instance. This saves analysts significant amounts of time in conducting pattern-of-life analyses or collecting other activity-based intelligence.
Specifically, companies like Orbital Insight select areas of interest and regularly monitor them over time. Orbital Insight observes and analyzes consumer traffic at a quarter of a million retail locations, including 3,300 high-demand US shopping centers. The company’s car detection algorithm uses wide area object detection from Pléiades imagery to accurately identify and quantify cars. For example, in 2015, there were two outbreaks of E. Coli at Chipotle food outlets. Following this, Orbital observed a sharp decline in car traffic at the chain’s restaurants, which was an invaluable predictor before a 40% decline in the stock price.
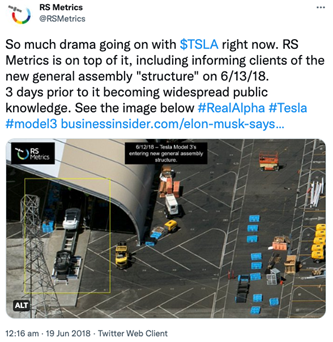
Another example of car counting relates to the production of vehicles. In June of 2018, RS Metrics informed clients of the latest developments at Tesla. Three days before it was public knowledge, they revealed details of changes to Tesla’s manufacturing activity, including a new assembly line structure, and increased output production rates. Canny investors were able to act accordingly.
Vegetation indexes
Well known by the Earth observation industry, but probably less so by commodity traders, vegetation indexes can help to analyze key parameters related to crops.
Normally used for precision agriculture, vegetation indexes offer traders unique insights into crop acreage and likely yields, which lead directly to prices of agriculture products. The algorithms used for this sort of analysis include NDVI (which stands for normalized difference vegetation index) and Moisture Stress Index, among others.
Such analysis can be done based on open source data such as Sentinel or nearly any other satellite data. One of the notable examples is mentioned by Planet. Its spectral analysis algorithms can differentiate between different crop types such as soy and corn, aiding the prediction of annual yield estimations (and, consequently, price projections). Planet makes multiple captures of this data throughout the growing season, before the US Department of Agriculture (USDA) publishes their annual crop acreage report at the end of June, meaning traders can get ahead of the game.
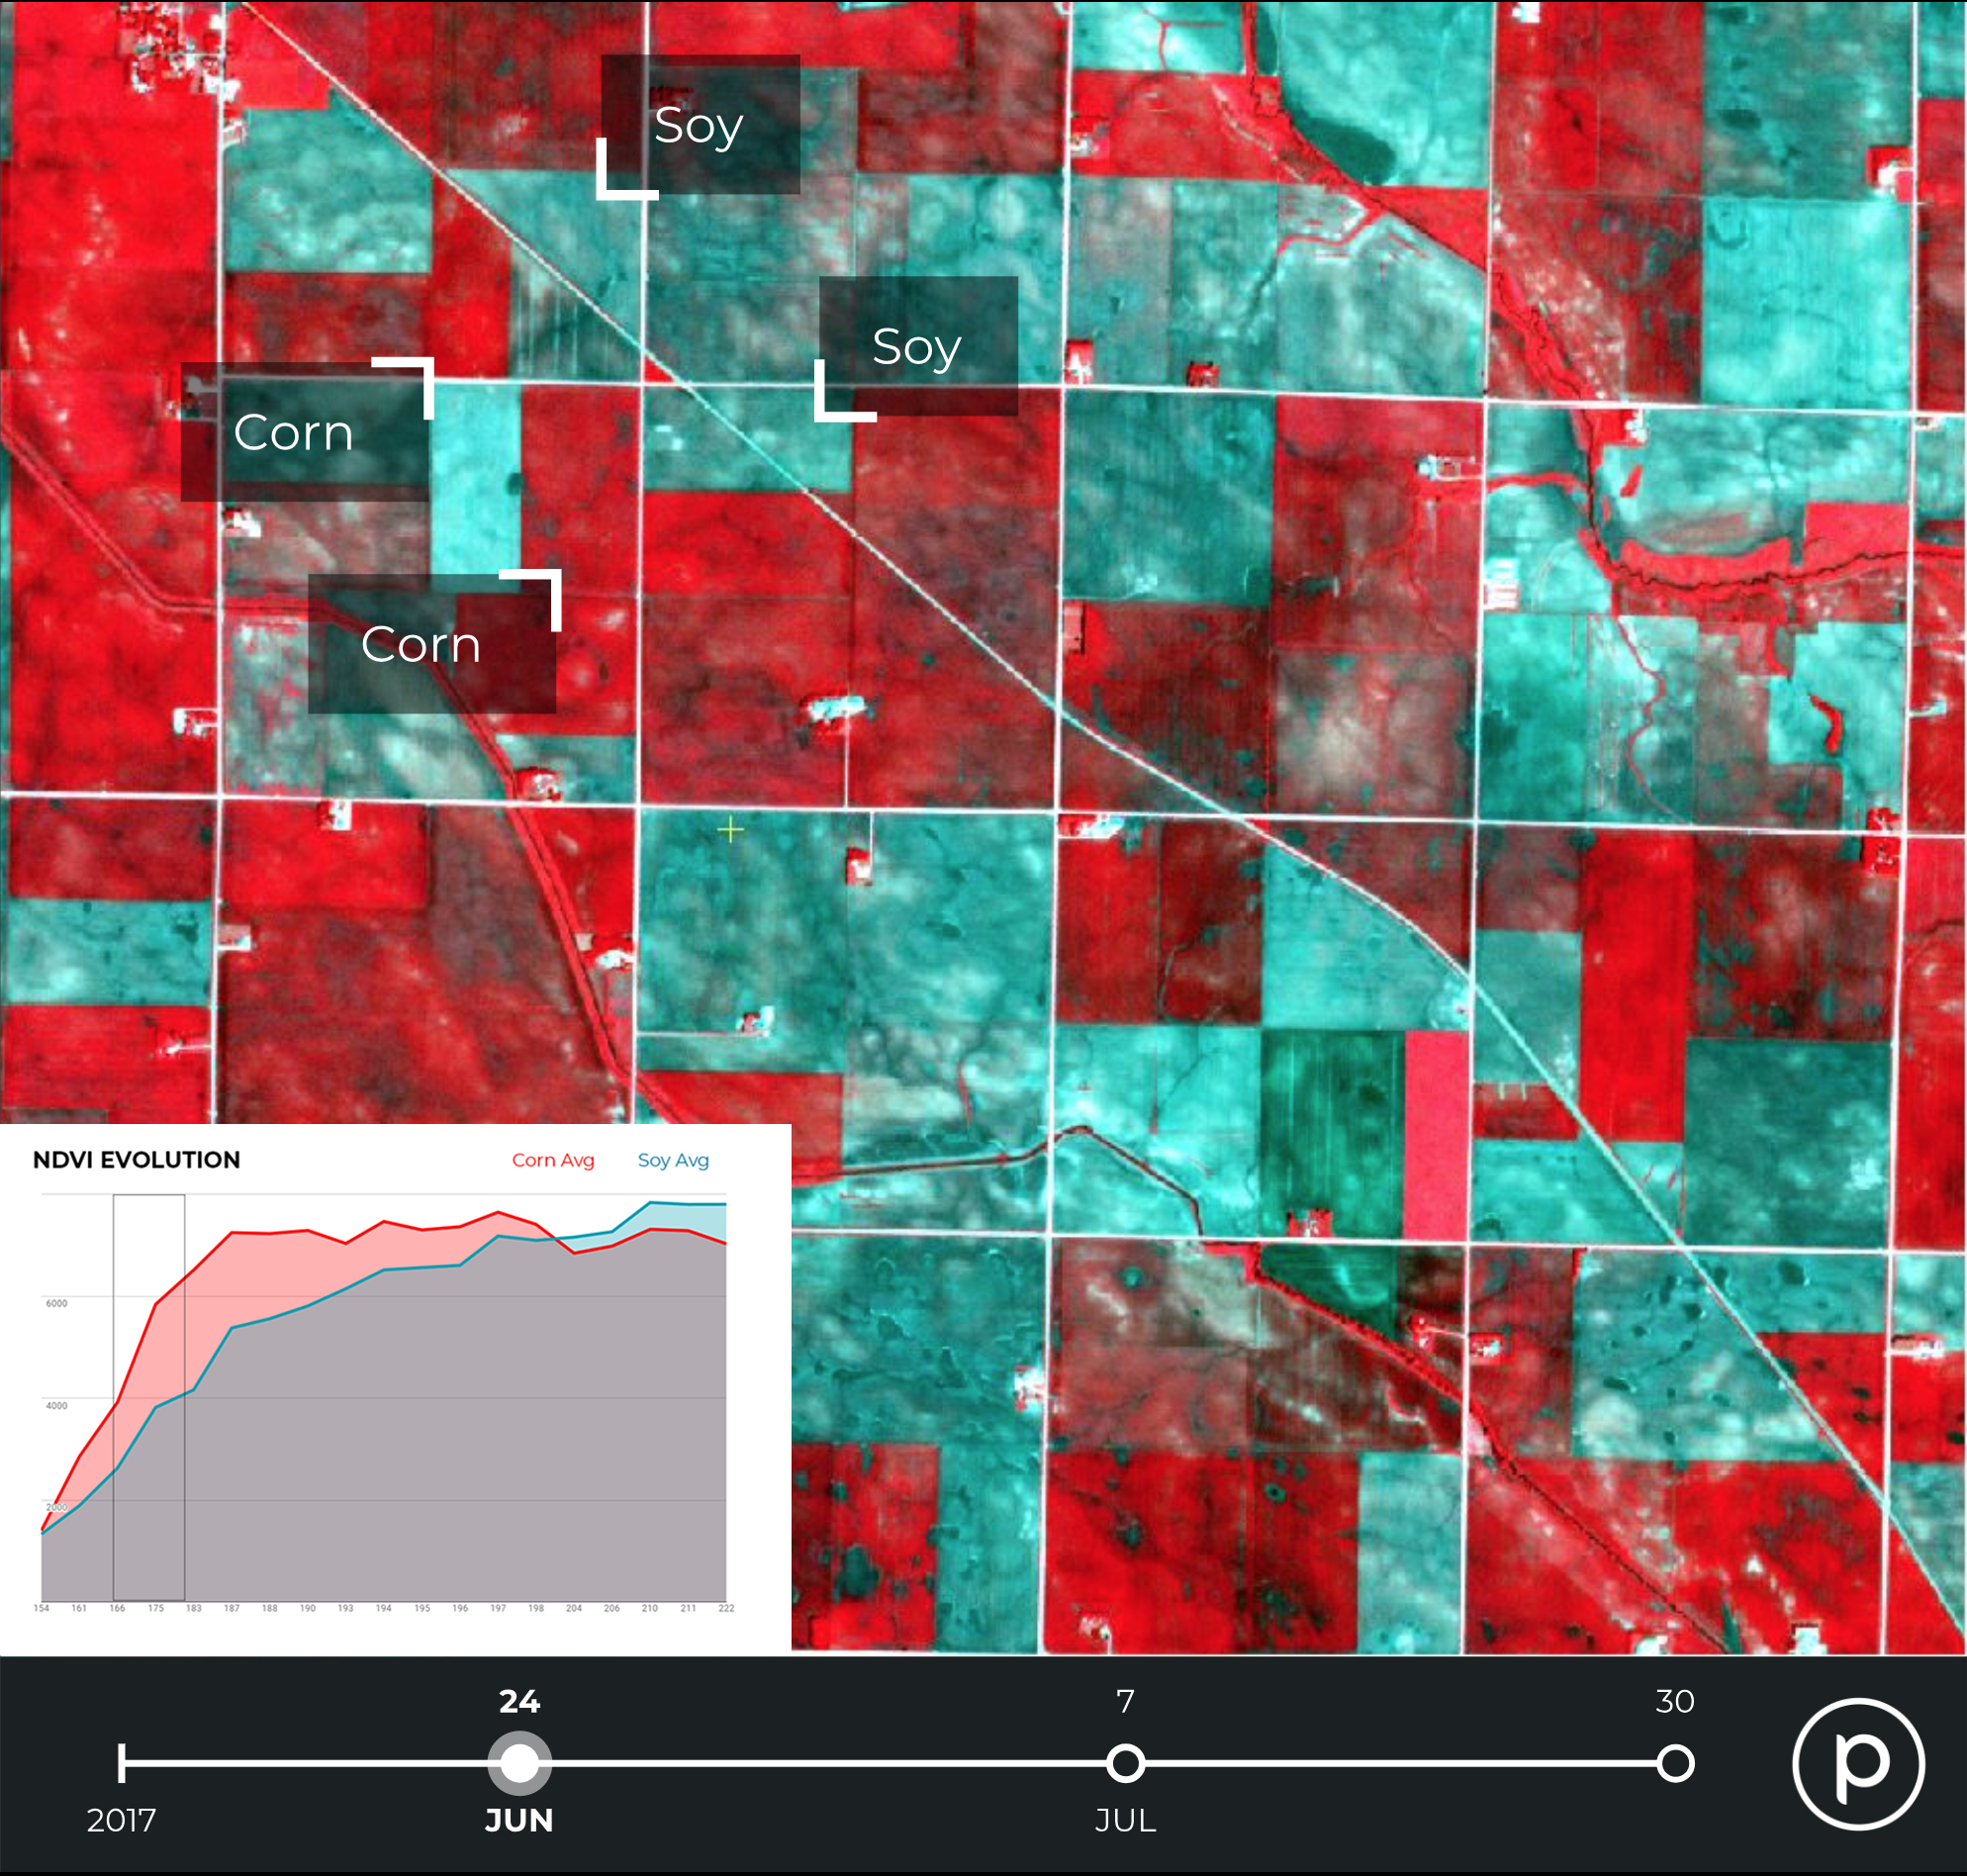
Planet: Soy and corn crops identified by NDVI
Change detection
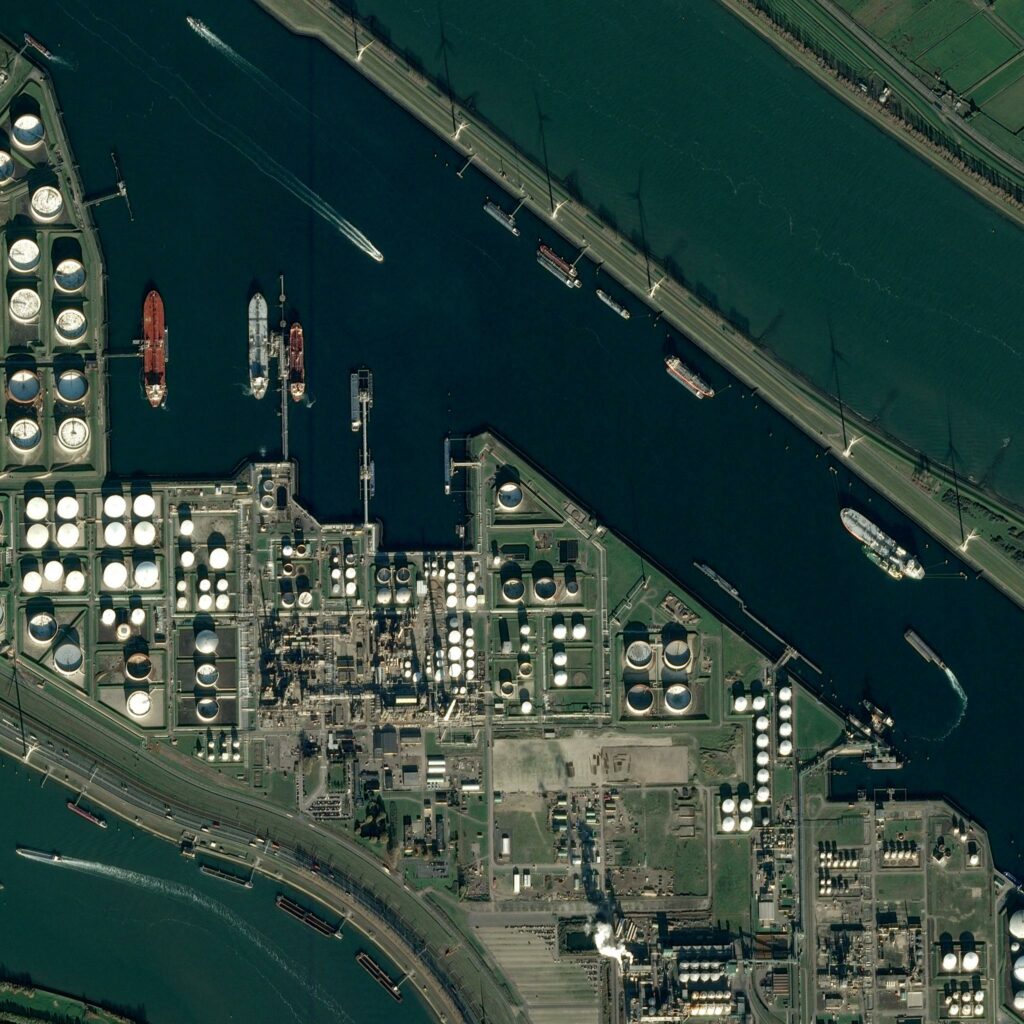
Change detection refers to the use case in which companies select areas of interest and periodically analyze the imagery to detect changes or anomalies, on newly available, archived, or tasked imagery. This is of particular interest when it comes to the hugely significant oil and gas industry (although there are, of course, many other applications).
Airbus, among other players, offers a Storage Tank Detection model which can monitor areas of interest to detect new oil and gas infrastructure and then compare it with the past data. At the height of the pandemic, information from satellite data proved to calm investors’ fears that storage facilities were reaching capacity, pre-empting a recovery in oil prices.
Interestingly, satellite data is used to estimate the amount of crude oil in storage tanks, by measuring shadows. Oil is often stored in tanks which have ‘floating’ roofs, which rise or fall depending on how much oil is inside. By capturing the crescent-shaped shadows cast by the sun, the algorithms can detect and measure the height of the roof and therefore the quantity of oil within. This technology is of particular use when it comes to emerging markets, like China, where data is less available.
Change detection is also relevant for analyzing supply chains, especially at sea, providing data on factors including port traffic and occupancy. A powerful example of this could be seen during the Ever Given Suez Canal blockage, where satellite imagery was able to show the number of cargo ships queuing in the canal, and the progression of the operation to release the trapped vessel.
Digital elevation models and volumetric measurements
Most satellite analytics is done in 2D, but another use case finding popularity relates to 3D data. This enables measurement of volume, and can be derived from stereo-enabled satellite imagery, which are used to produce digital elevantion models such as WorldDEM dataset from Airbus with 12m resolution and the forthcoming WorldDEM Neo with a higher 5m resolution.
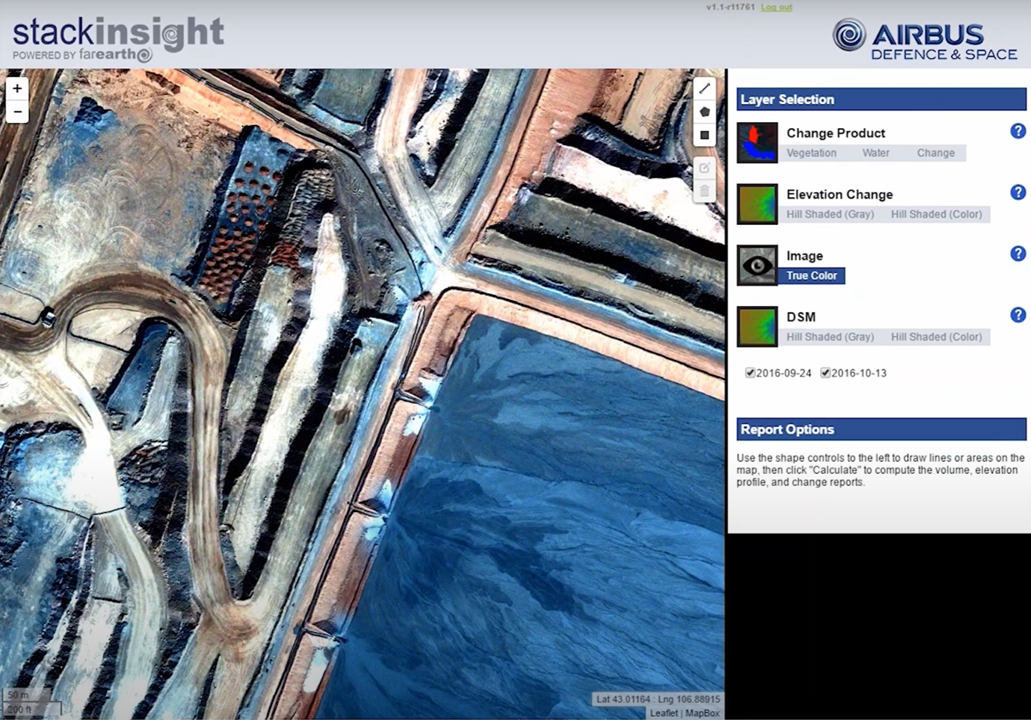
Airbus: still from ‘stack insight’ explanatory video
Most commonly used in the mining industry, such data can be applied to estimate the extraction of raw materials at open-pit mines, by measuring the size of stacks at the site. One example of this is at Kumba Iron Ore’s massive 100km2 open pit mine in South Africa, where Airbus and technology firm Pinkmatter have collaborated to provide Kumba with weekly updates featuring accurate information on extraction volumes and other changes on site.
Beyond mining, digital elevation modeling has the potential to be used for any type of material that can be stacked or piled, including building materials or raw products like timber. Data such as this could be used in conjunction with other, previously mentioned algorithms (such as object detection for the number of vehicles visiting a site), to further inform investors on production activity, for example.
Invaluable information for the future of commodity trading
Earth observation can provide critical information to traders, investors, and other stakeholders in commodity trading. Traditional models often rely on historical or theoretical data, but by providing real-time data on production, inventories, and supply chains, satellite imagery and analytics can greatly increase the reliability and accuracy of future price predictions.
From a technical perspective, it’s incredibly straightforward to use satellite data for remote sensing and analysis. However, it can be difficult to do that at scale—and in these cases, solutions such as off-the-shelf data and algorithms (from platforms such as UP42, for example) could be used to make it easier.
Of course, there is an added challenge when integrating satellite data with existing forecasting models (which can be unreliable), and stakeholders are still discovering how best to use the data. But, with the growing number of satellites providing imagery and the maturity of algorithms to perform analysis, it seems inevitable that satellite data will be playing an increasingly major role in the sector, reshaping how traders invest in stocks, commodities, and real assets.

#Data source

Next article
It’s Easier Than Ever to Buy Satellite Data for Your Project
Editor’s note: This article was written as part of EO Hub – a journalistic collaboration between UP42 and Geoawesomeness. Created for policymakers, decision makers, geospatial experts and enthusiasts alike, EO Hub is a key resource for anyone trying to understand how Earth observation is transforming our world. Read more about EO Hub here.
Buying satellite data isn’t an easy process. Historically, satellite companies have dealt in huge multi-million dollar contracts and have been less likely to spend time on smaller clients. The lead time for receiving purchased data can be days or even weeks, and pricing is often confusing.
In short, in the world of instant online purchases and payments, it’s still catching up... But it’s getting easier. There are several startups and marketplaces that offer a quick route to purchase satellite data from a variety of vendors. For customers looking to buy a smaller volume of data than a government (i.e., most of us), their services are likely to be useful.
The UP42 Marketplace
We’re going to use a well-known player in the industry as an example: UP42. This Berlin-based startup offers a developer-centric platform that enables customers to buy, process, and analyse satellite data at scale, all together in a single environment. Besides the option to download purchased data, the platform offers enormous possibilities for processing and analytics, with over 85 dedicated algorithms that can be used to analyse the purchased data. It features algorithms from cloud masking and vegetation indexes to large-scale, Deep Learning-powered detection of objects and features.
Besides being a developer platform, the UP42 interface makes it easy to buy and download satellite data for any geospatial project and offers full transparency over the cost. The platform lets users buy credits (for €0.10 per credit) and use them for data purchase and processing.
In the video below, I’ve bought a 0.5m Pleiades satellite scene for about €32, which is very reasonable pricing. The UP42 console allows you to search and filter for data on a map; after selecting an area of interest, the dataset can be purchased in just a few clicks. The platform does need time (from several minutes to a few hours) to process the data, but following that, it is then available for download.
Another great trick that UP42 has up its sleeve is the Urban Super Resolution algorithm, which uses machine learning models to synthetically improve the resolution of the 0.5m data to about 15cm. This produces surprisingly good results and improves the usability of the data for analysis.
Data Outside the Catalog
Currently, UP42’s Catalog hosts commercial archive imagery from Pléiades, Pléiades Neo, TripleSat, Near Space Labs, and SPOT 6/7, along with Sentinel 1, 2, 3 & 5 from open sources. The UP42 team is working on integrating many other vendors. Data outside the catalog can currently be bought on request via satellite tasking from vendors including:
- Optical: Airbus, Head Aerospace, SIIS (KOMPSAT), 21AT, Nearmap
- SAR: Airbus, SIIS (KOMPSAT), Capella Space
- Elevation models: Hexagon, Nearmap
- Hyperspectral: Head Aerospace
Democratizing Earth Observation
Buying satellite data online (especially for smaller geospatial projects) has been a significant challenge for a very long time. Platforms like UP42 make it much easier for the geospatial community: data can be bought and downloaded in a matter of just a few clicks, with full cost transparency in the process. I’m certainly looking forward to other satellite constellations being added to the catalog to make my life even easier, but it’s already a big positive step towards the democratization of Earth Observation data.