
This StoryMap (first published on MapAction’s blog in November 2020) explains how some of the over 200 maps international humanitarian charity MapAction created following Hurricanes Eta and Iota in Central America in November 2020 were used to help get aid to people that needed it. Click here to view it in full screen.
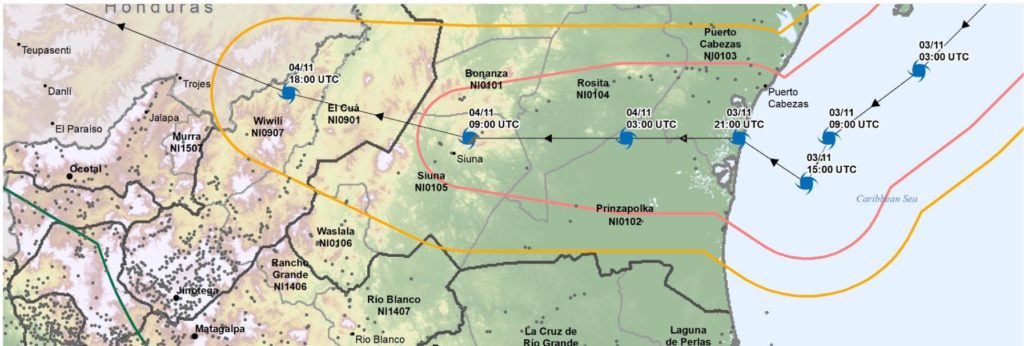
In November 2020, a three-person MapAction team travelled to Guatemala following extreme flooding and catastrophic landslides in 12 of 22 of the country’s administrative departments. This was caused by two severe hurricanes hitting the Central American region in quick succession. Around 6 million people were affected in Honduras, Guatemala, and Nicaragua and 590,000 had to leave their homes.
Ten departments of Guatemala declared a state of emergency and the government requested international assistance.
The devastating storms came on the back of social and economic hardship caused and exacerbated by COVID, unemployment and population displacement. The flooding caused widespread destruction of crops and livestock and around 5,000 wells were contaminated.
MapAction’s assistance was requested by the UN’s Office for Coordination of Humanitarian Affairs (OCHA). We helped to gather and map information about the evolving situation on the ground. This included mapping storm tracks, flood extents, building damage, affected populations and information about what assistance humanitarian teams were already providing in different locations so that gaps could be identified and rapidly addressed.
In addition to the Guatemalan team, a five-person MapAction team was already providing full emergency support remotely to OCHA’s Regional Office for Latin America and the Caribbean (ROLAC) from 6 November following Hurricane Eta, while another team member had been seconded to ROLAC full time from September 2020 to assist with hurricane preparedness and other humanitarian issues across the region.
MapAction volunteer Emerson Tan filmed a vlog from the airport on his way back from Guatemala:
Did you like the article? Read more and subscribe to our monthly newsletter!


#Sector

Next article
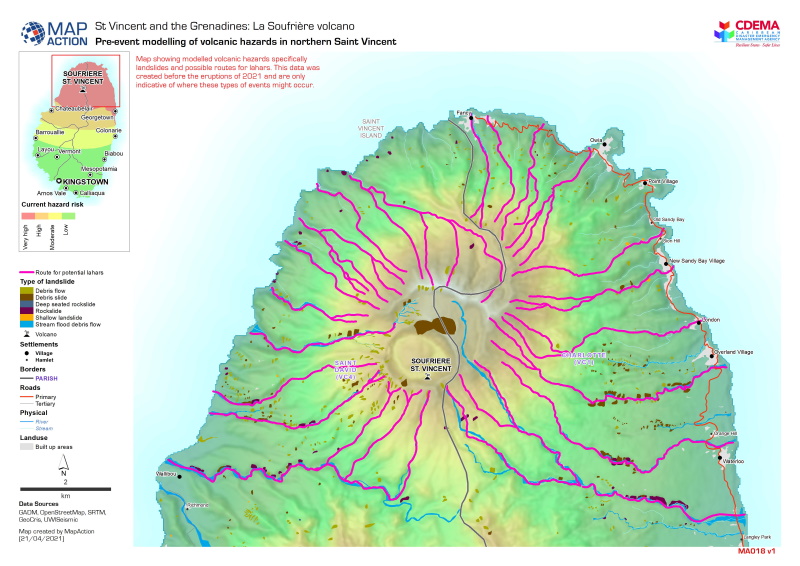
St Vincent and the Grenadines La Soufriere volcano: pre-event modelling of volcanic hazards in northern St Vincent
International humanitarian geospatial charity MapAction has been providing mapping and information management support to the La Soufrière volcano emergency on the Caribbean island of St Vincent, in St Vincent and the Grenadines. We’ve been helping the Caribbean Disaster Emergency Management Agency (CDEMA) and the UN’s Environment Emergency Teams understand the evolving impacts of the crisis.
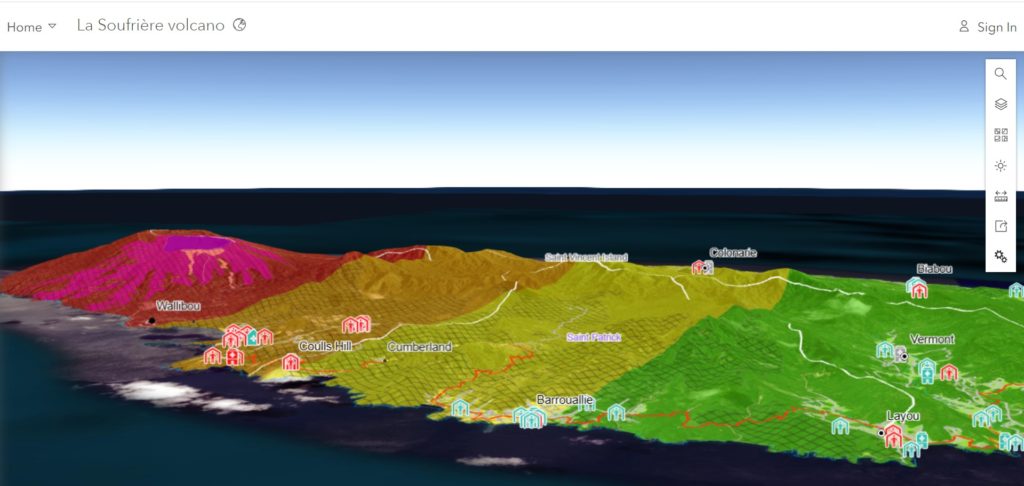
3D web map shows the observed volcanic events from remote imagery
Explosive eruptions from La Soufriere beginning on 9 April caused ash clouds to cover much of St Vincent, Bequia and southern St Lucia, as well large parts of Barbados. The volcanic dome collapsed and pyroclastic flows descended from the mountain top. By 7 April, around 16,000 residents had been advised to evacuate following early signs of activity.
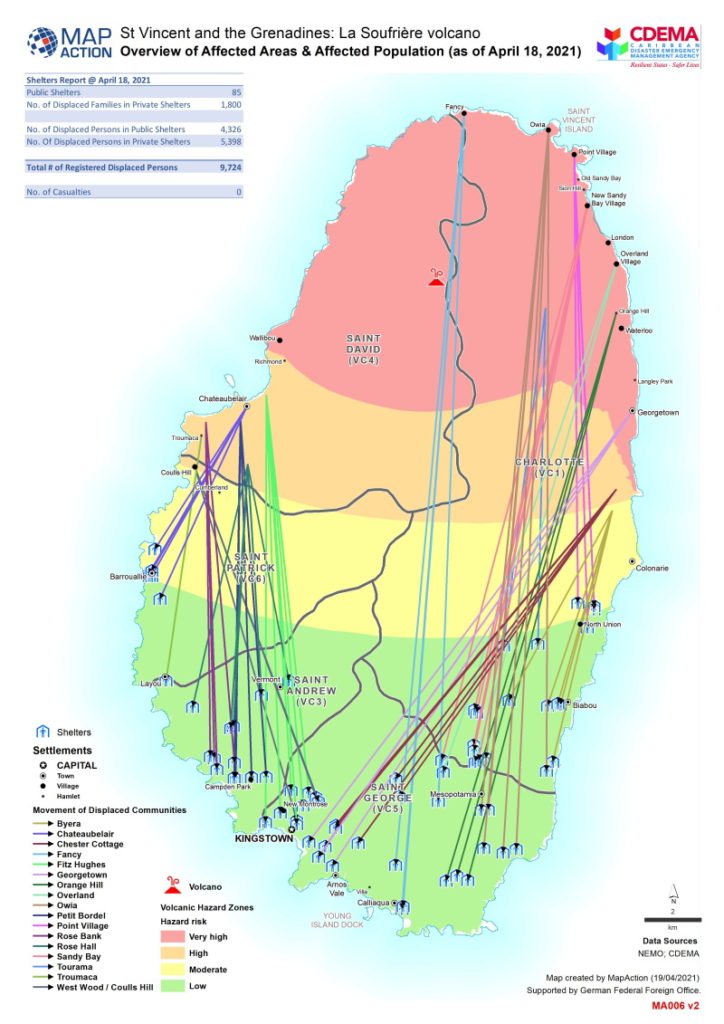
Overview of Affected Areas with volcanic eruption & Affected Population (as of 18 Apr 2021)
Monitoring of the volcanic eruption has been difficult as existing seismic stations were knocked out and it became dangerous to travel into the area. Recent rains have washed the ash into rivers and the surrounding sea, causing environmental damage. Mudflows (lahars) pose a dangerous threat to river valleys surrounding the volcano.
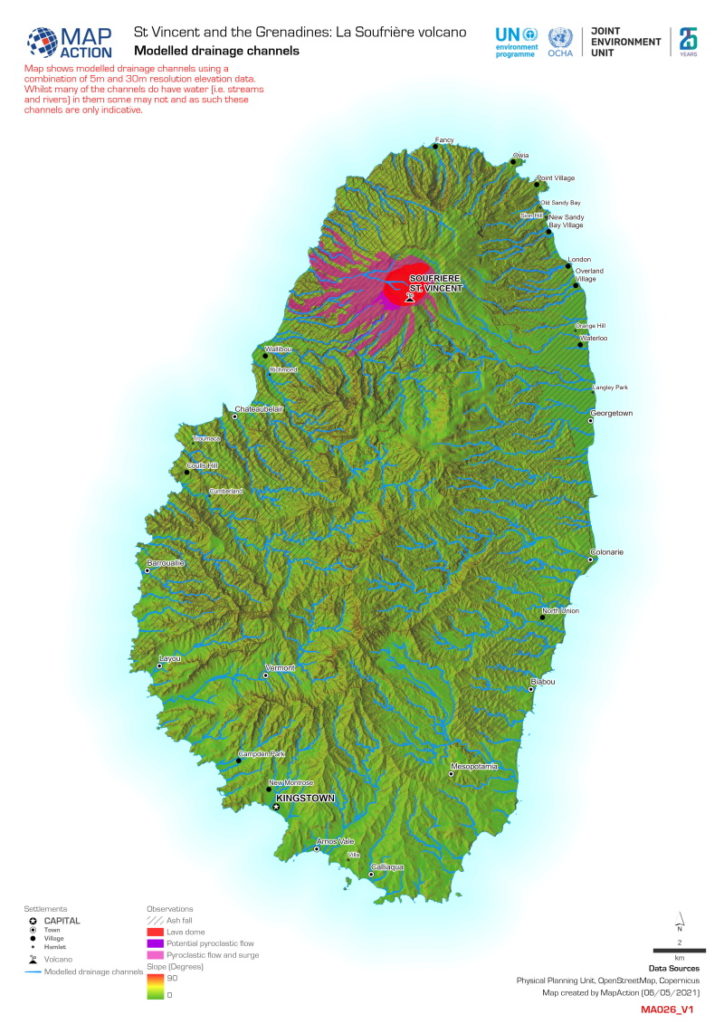
St Vincent and the Grenadines La Soufriere volcano: modelled drainage channels
 View all the volcano mapping relating to this emergency here or read the blog by MapAction volunteer Lavern Ryan about her experience of being a part of the response team.
Did you like the article? Read more and subscribe to our monthly newsletter!