
There is a lot of geodata publicly available. The Copernicus programme, for example, hosts 6 families of satellites (Sentinel 1 – 6) consisting of 30 operational earth observation satellites daily collecting images of the Earth. The current archive is already at several Petabytes and growing. One of the biggest challenges startups and scaleups are facing right now is how to add value to this geodata turning it into economically viable solutions, with remote sensing data being the center of focus. How to make satellite data based products that add value to traditional markets which originally have a very low awareness of geodata? How to break away from the proven geodata markets driven by GPS and tracking mobile data? These are questions many geospatial companies ponder upon nowadays.
Towards zero deforestation with geodata
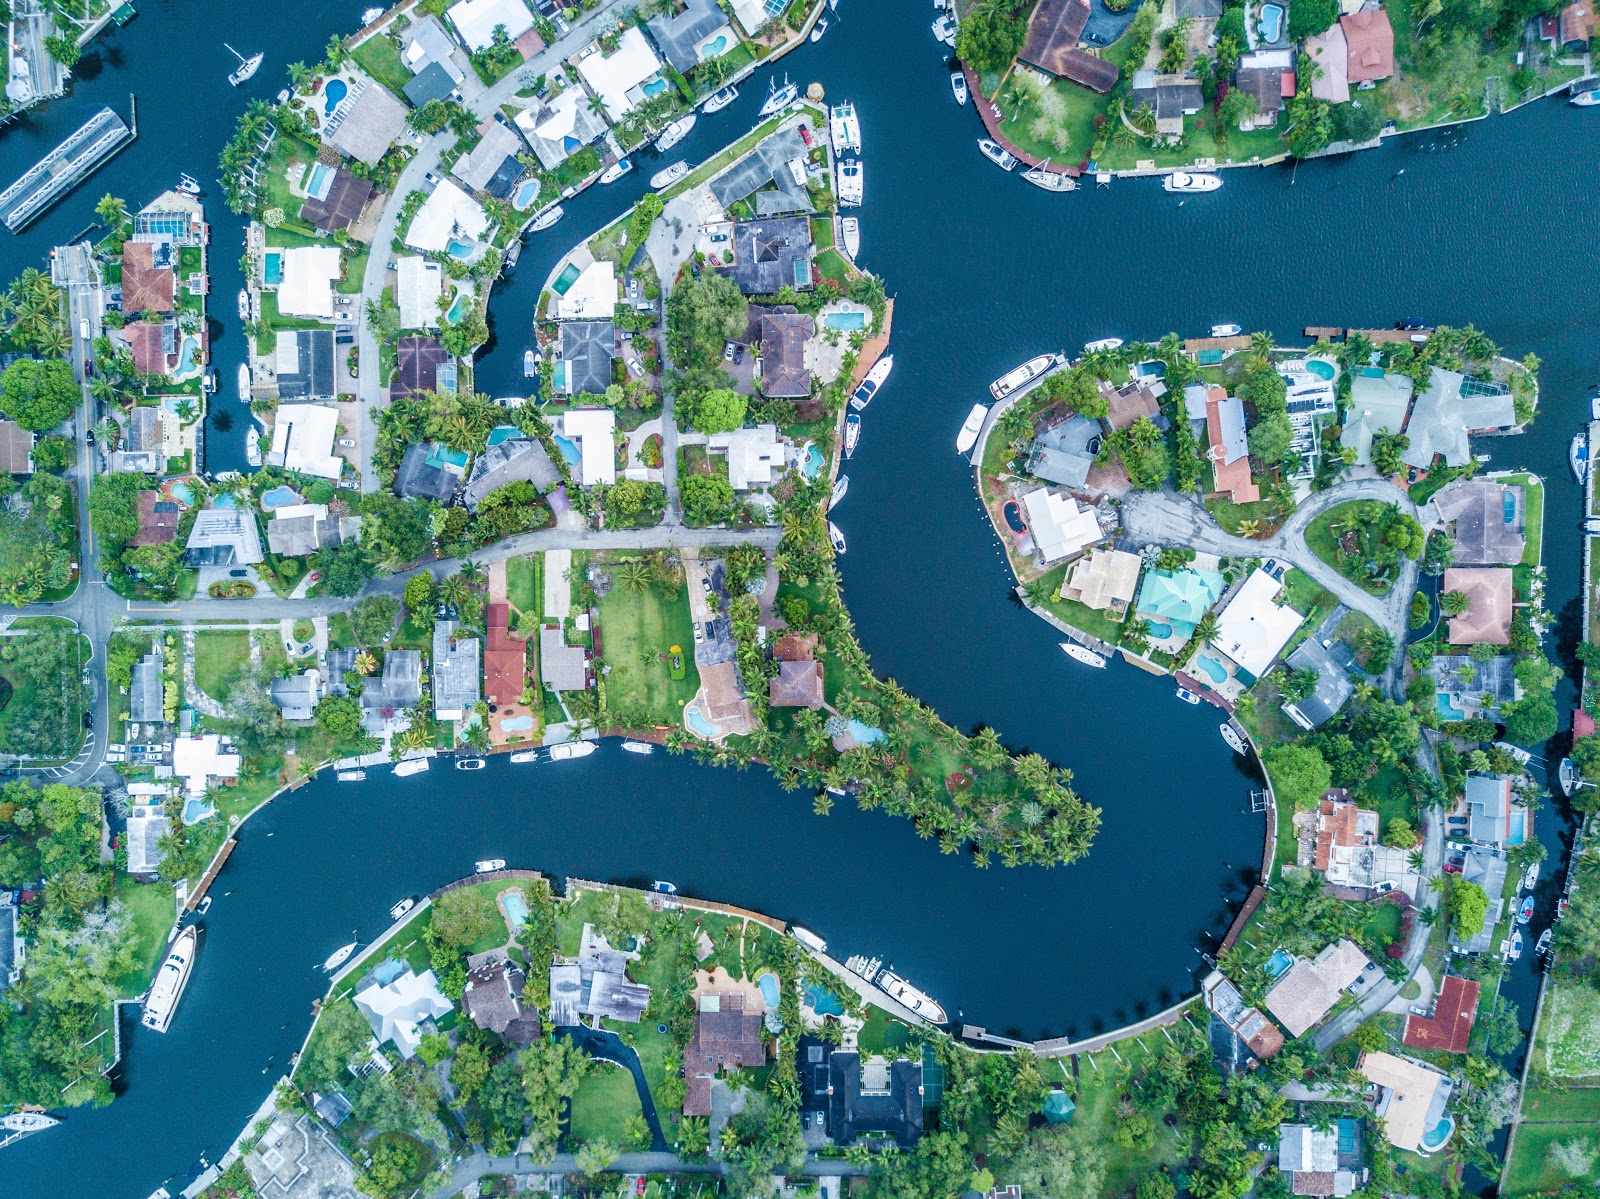
This is one of the reasons why we founded Satelligence. We wanted to stop deforestation by making satellite data based products for stakeholders in commodity production value chains. Before Satelligence, organisations relied on out of date, low accuracy or incomplete deforestation data. Either because of cloud cover hampering optical satellite observations. Or because of a lack of capacity to cover all tropical forests. These products enable them to act upon illegal deforestation events happening right now, be proactive in engaging supply chain stakeholders linked to illegal deforestation, and ensure future yields by monitoring crop performance.
We developed a solution for stakeholders in commodity value chains through a lot of trial and error. We started with 3 people in a single room outputting geotiffs to a single client. In 18 months we grew to a team of 18 people, including out-of-comfort-zone positions like marketing, sales and business development. The geotiffs became a pdf bulletin. The bulletin became an online platform serving 60% of the global palm oil supply chain. We expect to cover 80% of global palm oil production by the end of 2020. While building our solution, Smart Forest & Commodity Analytics (SFCA), we learned two things:
- It’s not only a successful product in itself, it’s also the basis for our product development. Since product launch in 2018 we are constantly extending the app with features like Historical Trend Analysis, Supply Chain Analysis, Automated proactive Grievance Response and, our latest effort, Carbon Stock Accounting (is the total amount of biomass in my investment area increasing or decreasing? keep an eye on our socials for updates);
- During the development of the product we distilled our own way of product development: Story Based Development.
We used what we like to call ‘the story-based development’ method to develop a new product for a traditional market: Financial Institutions.
Why Financial Institutions?
At Satelligence we are accustomed to dealing with stakeholders from soft commodity supply chains: producers, processors, traders, manufacturers and retailers. But all these stakeholders have something in common: they are all directly involved with Financial Institutions through loans and / or shareholdership.
critical investors are the new Greenpeace.
Second, there is a trend, also among Financial Institutions, towards Environmental, social and corporate governance (ESG) and sustainability investing or financing. If your organisation doesn’t have a public sustainability policy, you are not eligible for financing; if your organisation is linked to unsustainable practices like illegal deforestation, your shareholder composition will dramatically change and you can potentially lose millions of dollars of stock market value , investors will take their hands off you. You could state that critical investors are the new Greenpeace.
Therefore, Financial Institutions are a very attractive market for geospatial companies. The problem is: that sector doesn’t understand geospatial and we don’t understand theirs. If, for example, you show maps to FI people, they think they are on holiday because that is the only time they use maps. What we learned is to convert map data into graphs and tabular overviews. That is a format they are used to and makes the information actionable for them.
We closed that gap by applying our story based development method. A new type of product emerged. To understand how we got there, first you have to understand the types of FI’s and how they make money.
That is the topic of the next blog in this series: Geodata for Financial Institutions 2.


#


Next article

The environmental risks posed by climate change become clearer with each extreme weather event, but we are only starting to study the impact of these changes with an economic lens.
When researchers from the International Monetary Fund, the University of Cambridge, and the University of Southern California projected the long-term impact of temperature anomalies on global GDP per capita, they found that climate change could shrink the US economy by up to 10.5 percent by 2100. China is expected to take a 4.3 percent hit, while the European Union could witness a 4.6 percent reduction in real income over the next few decades.
Naturally, the debate over policy approaches to addressing climate change has become more vigorous among politicians and economists alike. And it is becoming evident that many of the core economic questions in the times to come are going to be climate-centric.
Consider some of the ways climate change could have a negative consequence on a country’s economy:
- Diminishing surface water and groundwater supplies from hotter weather decrease the crop yields in once-fertile areas
- Mounting losses from extreme weather-related events – right from increased wildfires in the US to flooding around Japan’s coats – threaten to bankrupt the insurance industry
- Extreme hot spells overload urban power grids, forcing electric utilities to spend millions of dollars in overhauling the energy infrastructure
- Hurricanes, made stronger by climate change, destroy roads and public property which must be rebuilt at great costs to the taxpayer
Improving resilience to climate change through space technology
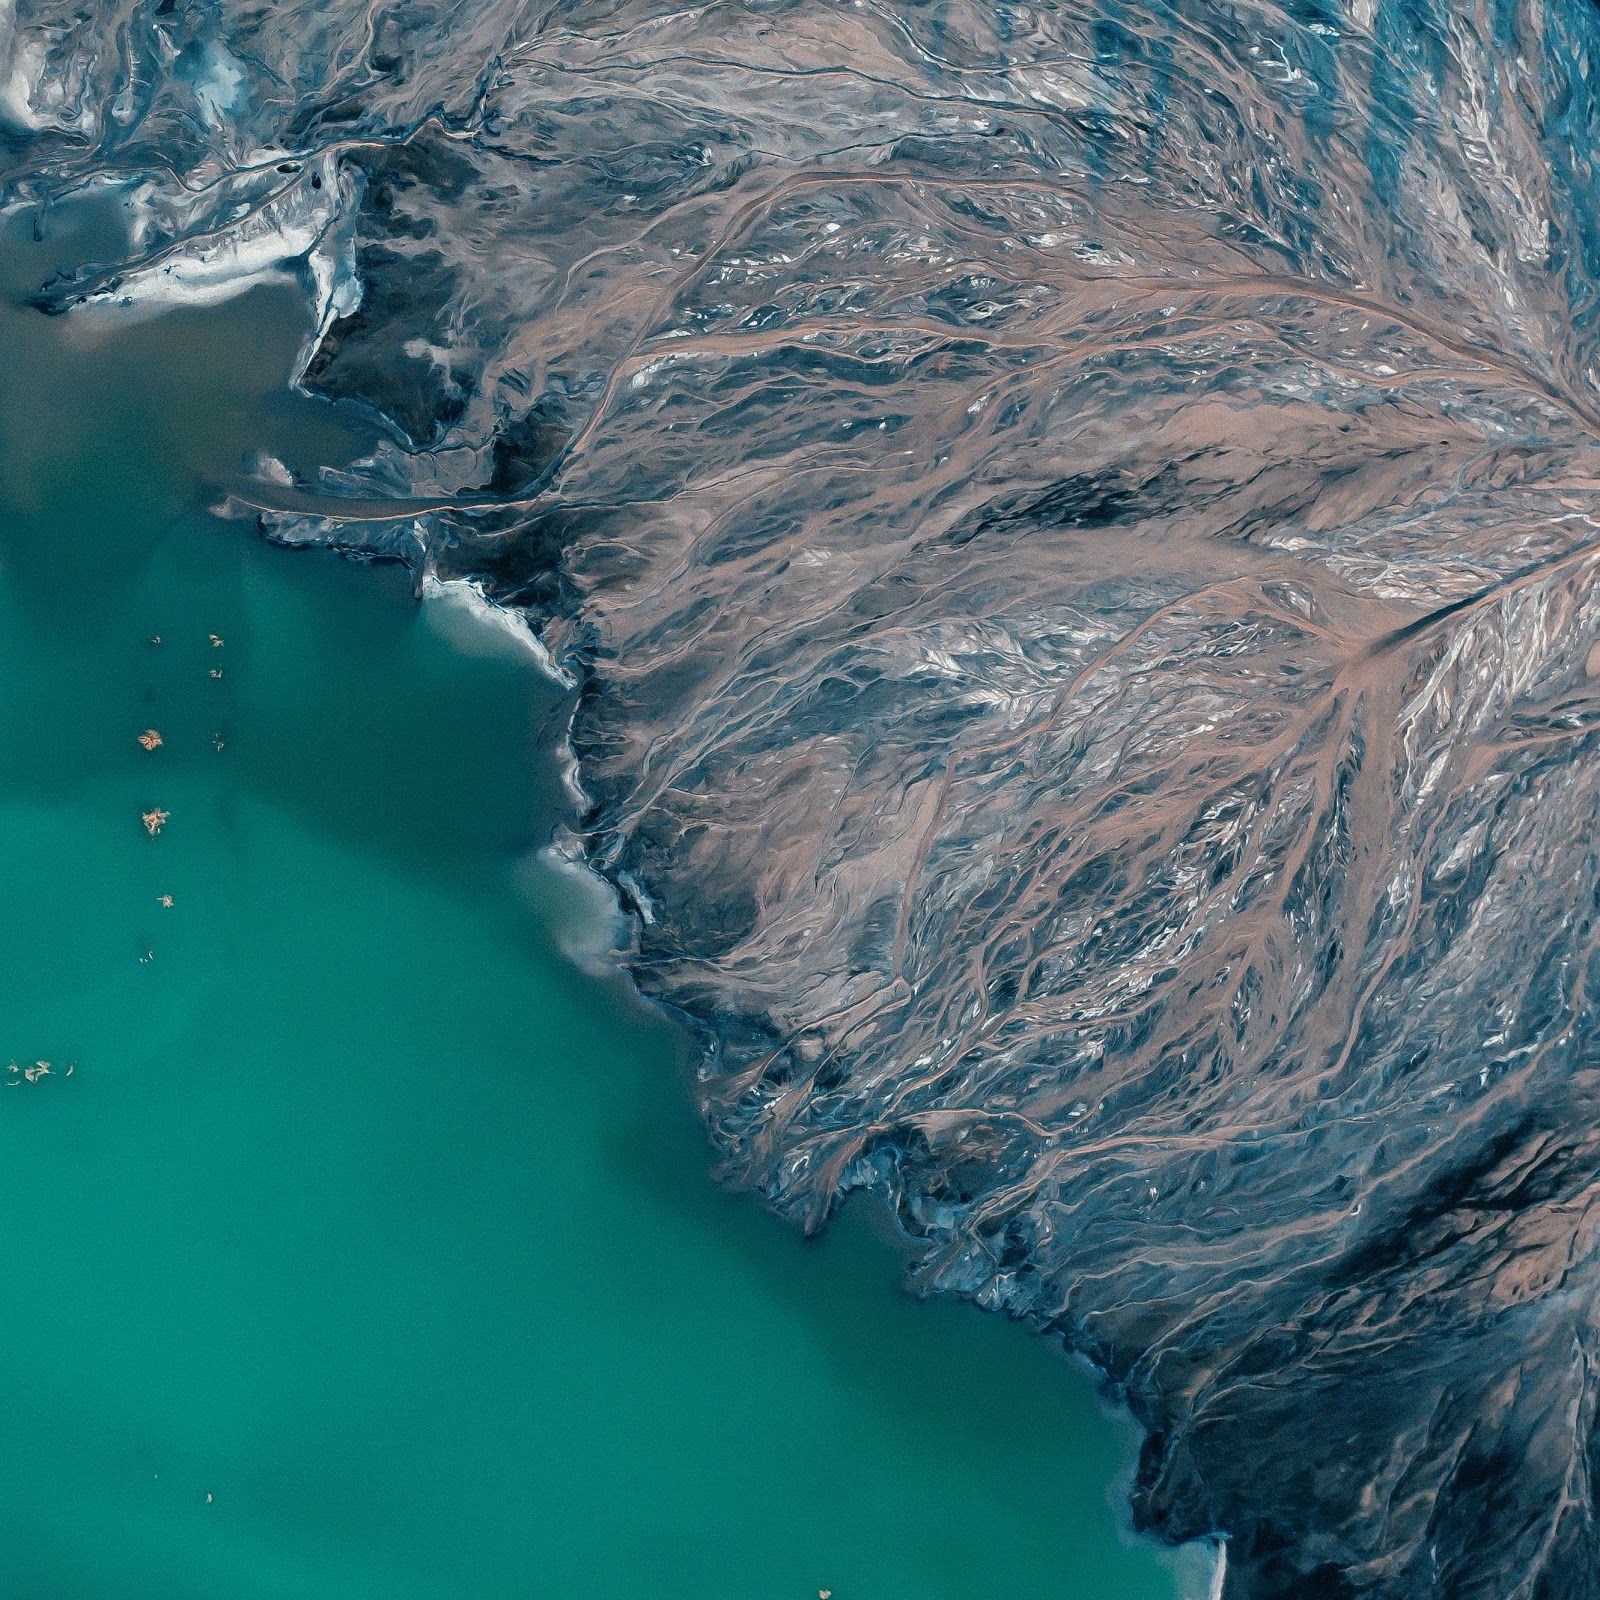
Continually watching our planet from a distance, satellites generate a wealth of robust scientific data that empowers researchers to understand the impact of climate change. Satellites provide a birds-eye-view of what is happening on the Earth’s surface, both at a local, zoomed-in level and on a global scale.
The same data, when coupled with intelligent machine learning algorithms, can be used to unravel thematic and historical trends in Earth’s behavior across different areas and verticals, and especially climate change.
Earth observation is crucial to understand patterns of sea-level rise, surface temperature changes, rainfall variability, or even the cooling effects of increased stratospheric aerosols. For example, Sentinel-5P data can be used to measure methane, while water vapor measurements from MODIS allow us to understand weather patterns. These measurements are essential to create data-backed policies for climate action.
Knowledge transparency about the past and the present empowers us to prepare for the future as well. Earth observation resources form the basis for predictive modeling, allowing communities and businesses to plan sustainably, improving their resilience to climate change.
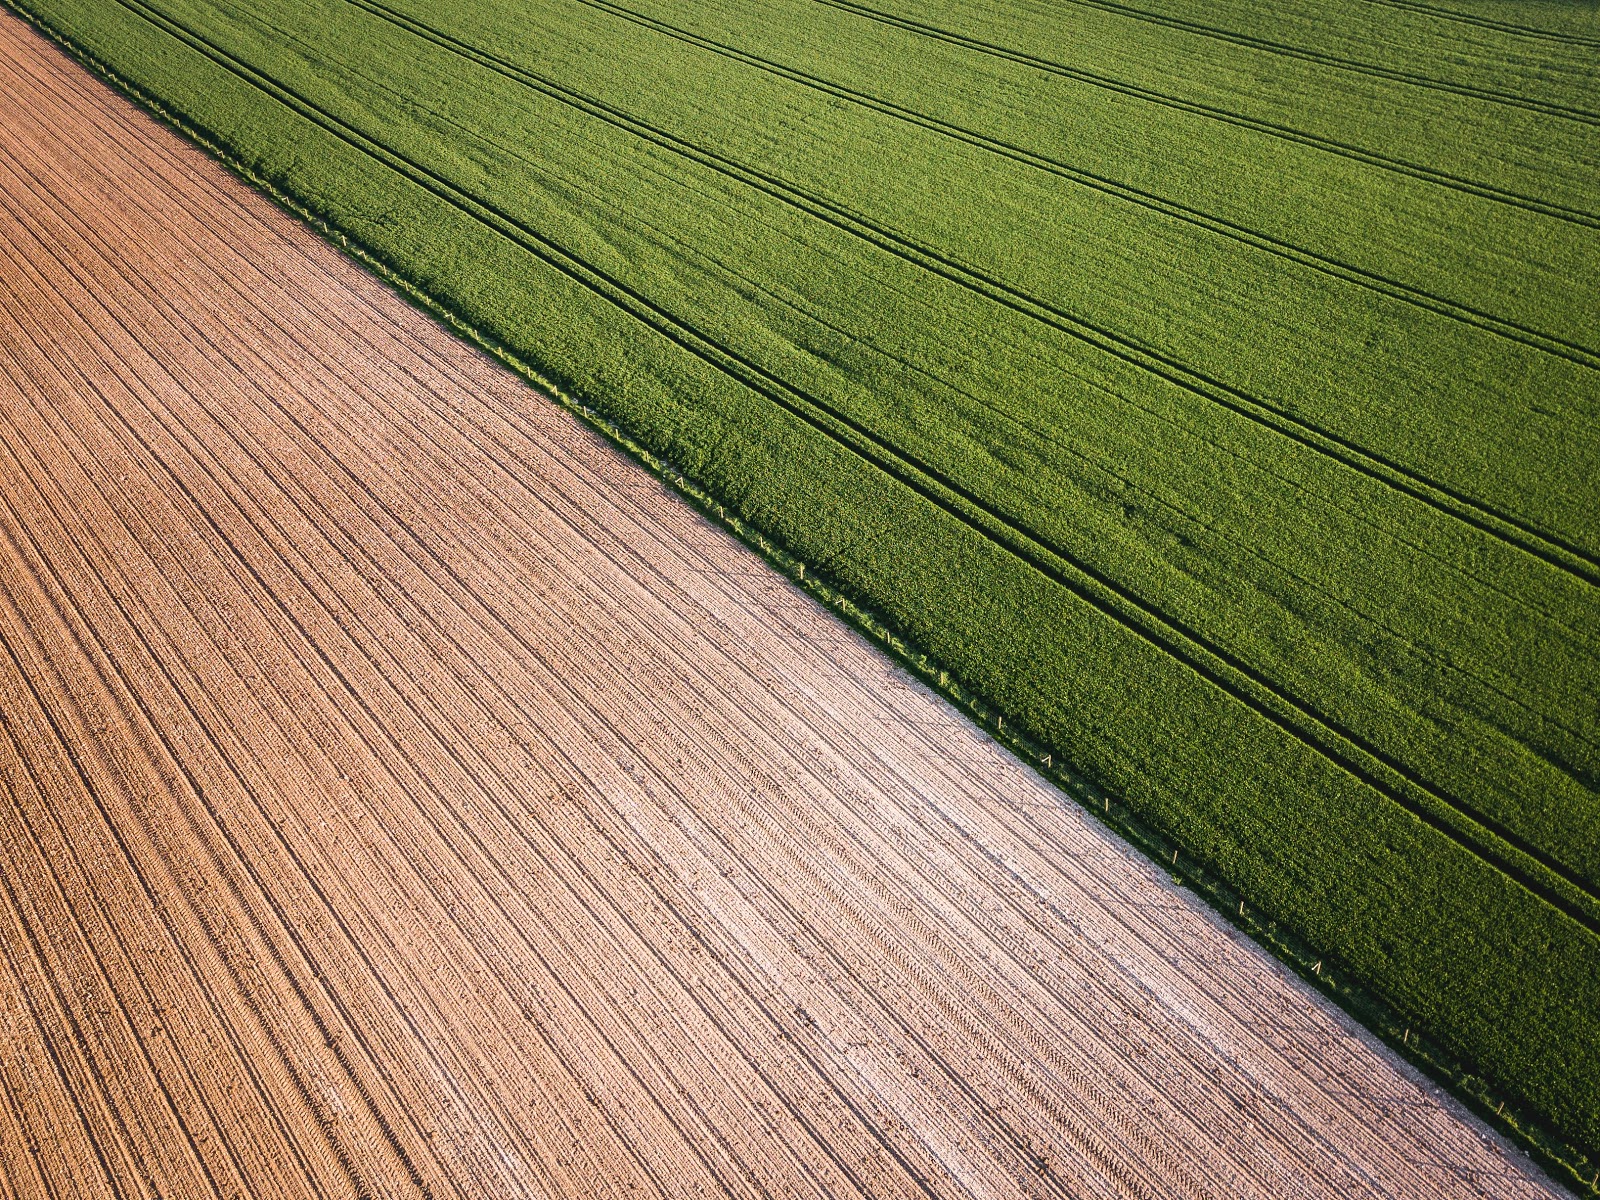
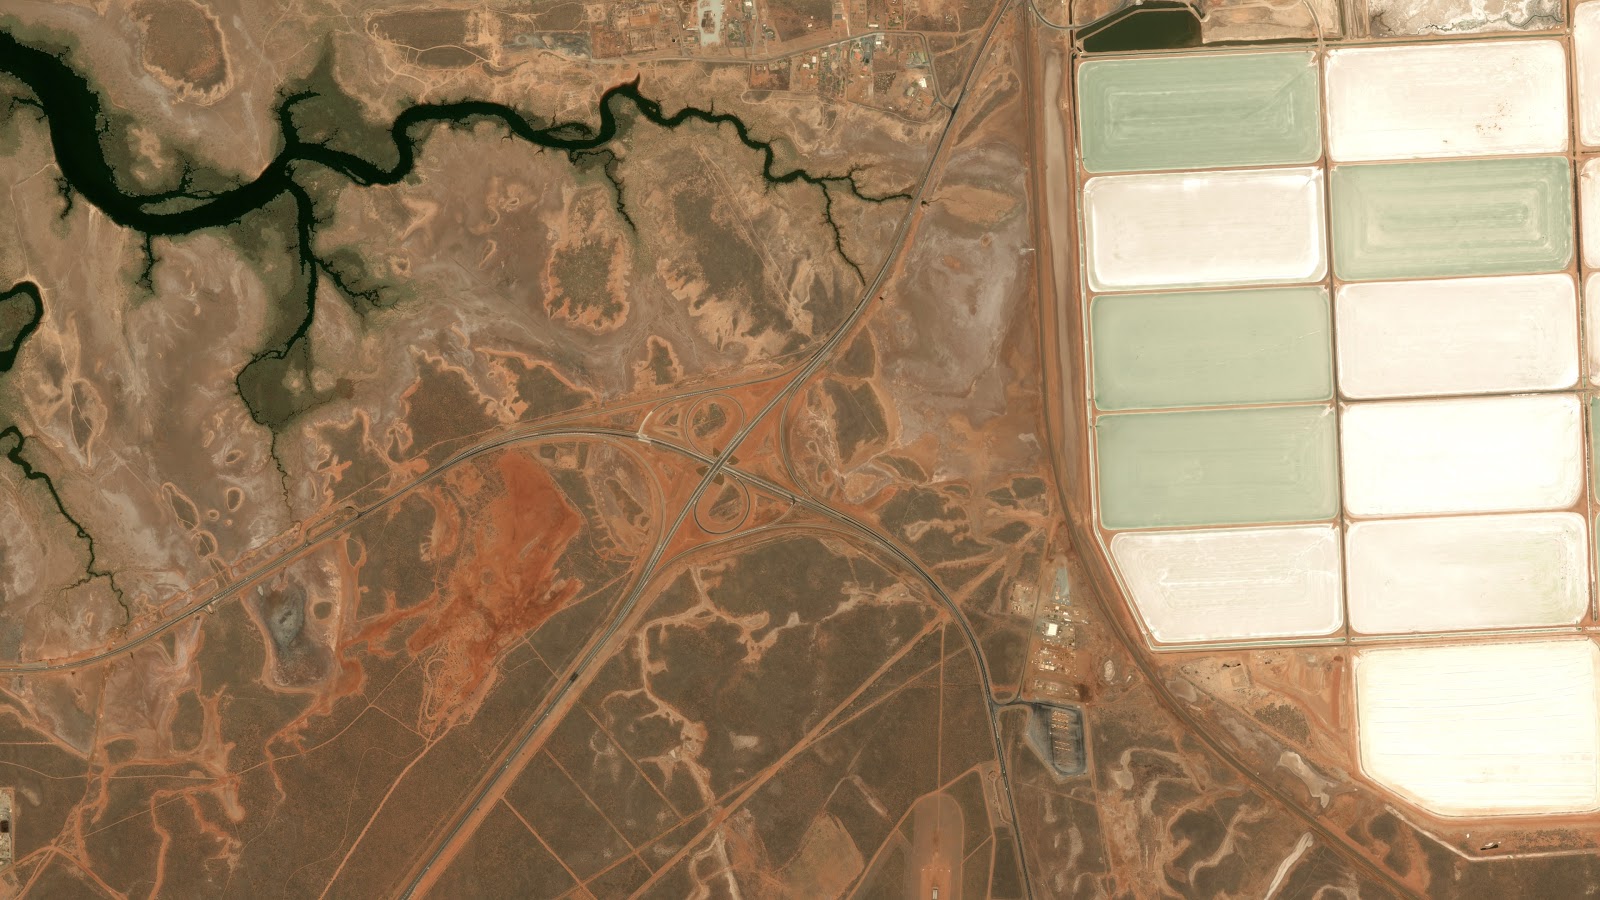
For example, farmers and governments can buffer the impact of drought by using real-time satellite data to monitor crop growth and development. Pan-sharpened imagery from SPOT/Pléiades can be used to calculate Normalized Difference Vegetation Index (NDVI), an invaluable resource to gain insights into crop health, yield estimation, and disaster assessment. When under-performing areas are identified before it’s too late, targeted application of fertilizers, pesticides, and irrigation can be taken up to mitigate the effect of incongruities in precipitation.
Similarly, insurers can take proactive actions to mitigate risk if they have actionable insights into their portfolio. Near-real-time weather data, when combined with environmental forecasting data from earth-observing satellites, allows insurance companies to map their exposed risk in a better manner. Further, they can use advanced analytics, such as the Automatic Image Anomaly Detection System (AIADS) algorithm, to detect temporal changes and gain the competitive advantage required to grow new ideas for offerings on risk indexes.
In the same vein, change detection algorithms can help utilities to make better decisions on infrastructure planning. Energy companies can leverage next-generation open earth observation data sources, such as Pléiades 1A/1B 0.5m resolution imagery, and Airbus change detection algorithms to measure changes at a specific location and thus prioritize their activities. Armed with better insights, utilities can optimize their outputs for predictive maintenance and forward-looking inventory planning.
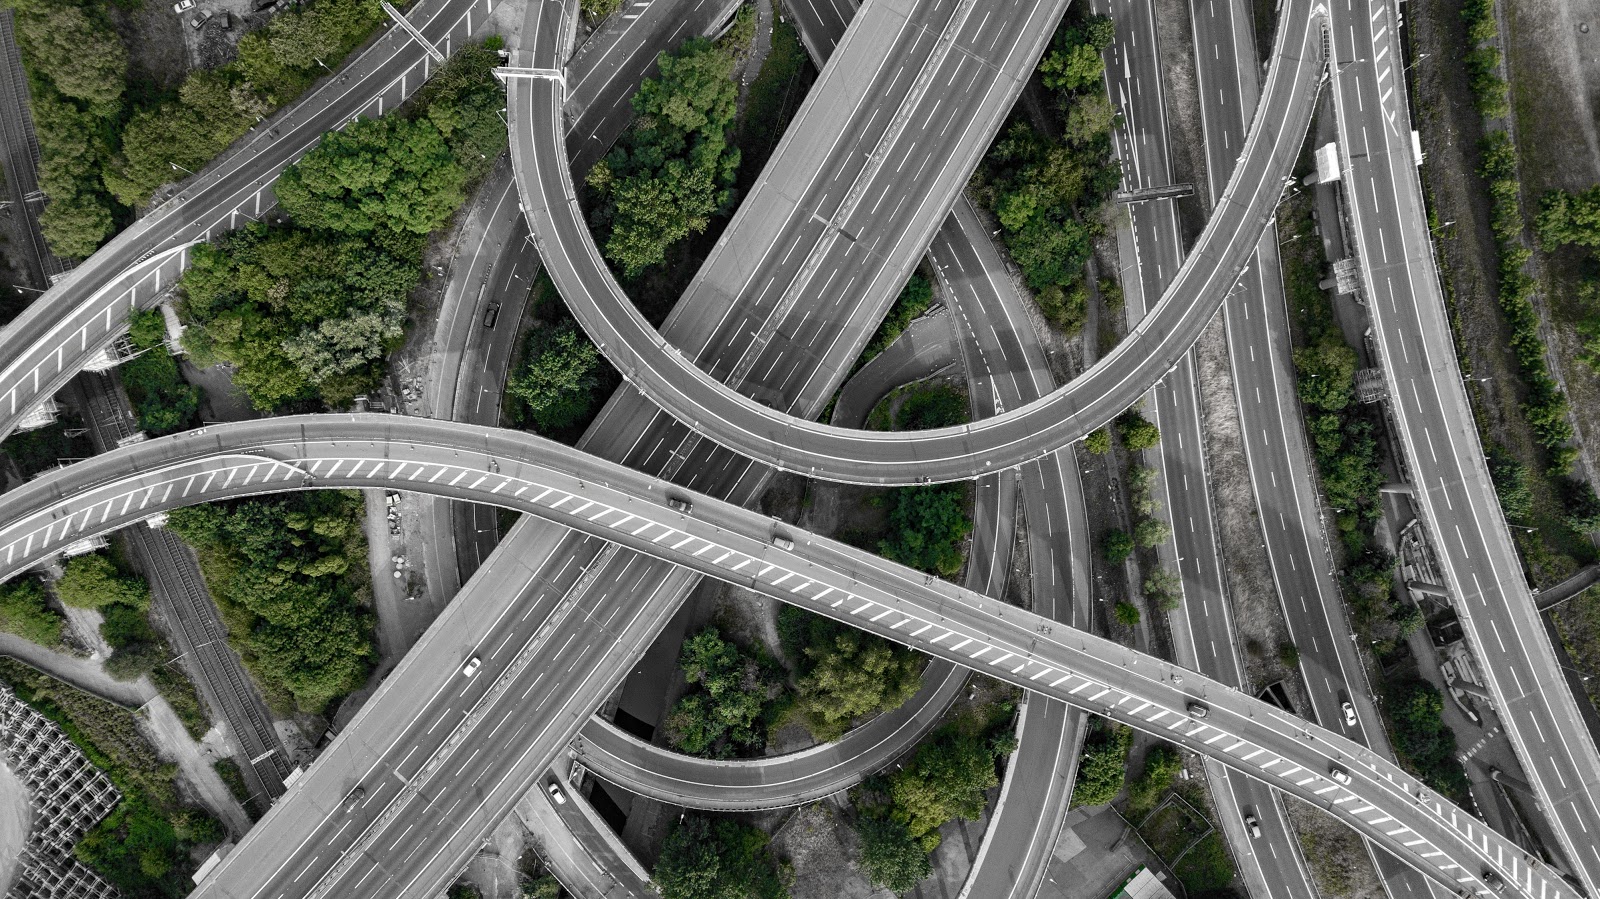
Correspondingly, high-resolution satellite imagery and advanced analytics are invaluable tools for optimizing infrastructure management and monitoring critical projects, especially as cities rebuild after climate change-induced natural disasters.
Not only can satellite data help to identify the most urgent infrastructure gaps, but off-the-shelf algorithms such as Vasundharaa’s urban estimation or Pinkmatter’s settlement mapping can support more effective long-term infrastructure planning. The progress of the construction can also be monitored in a consistent and reliable manner through high-resolution imagery.
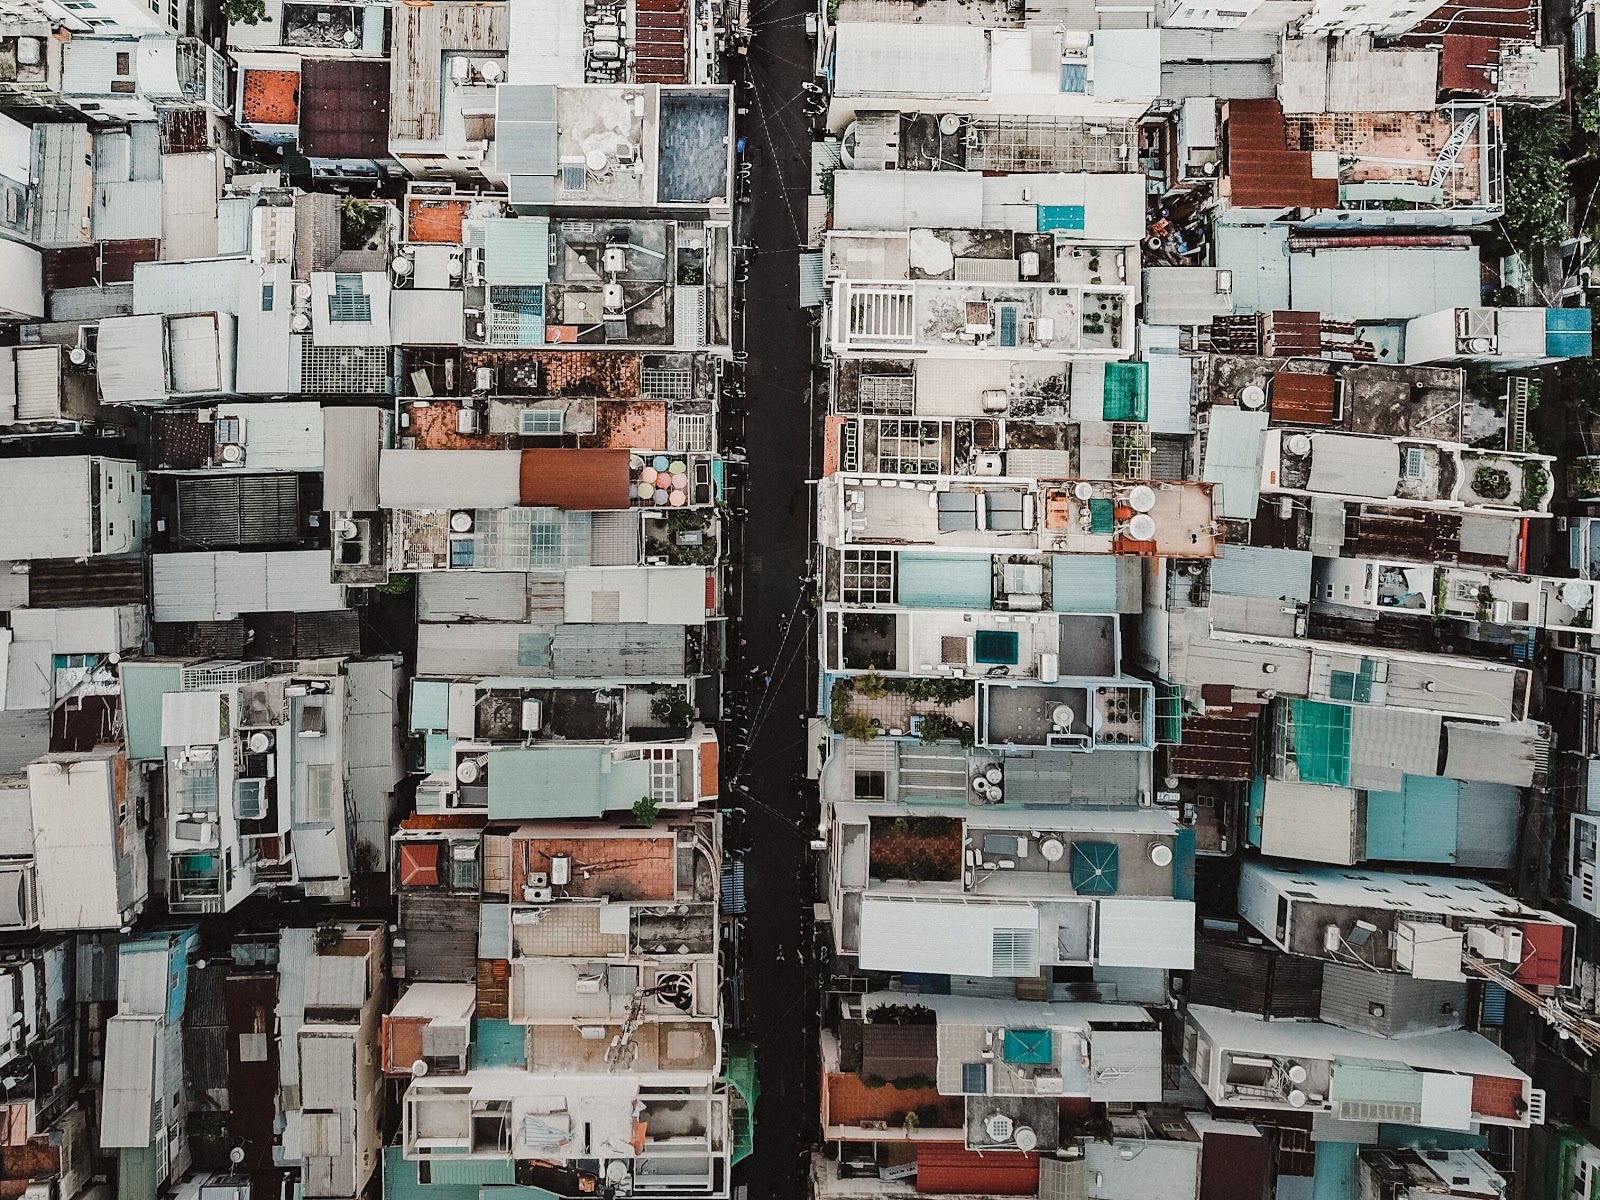
But not every city rebuilds. According to nonprofit group Oxfam, over 20 million people are forced to flee from their homes every year because of climate-fuelled disasters. To create disaster risk reduction plans and to manage response in times of need, governments and communities need evidence-based knowledge of the number of people displaced. Accurate, relevant, and timely satellite data can help with that.
Multispectral imagery from Sentinel-2 can assist with coastal area monitoring, inland water monitoring, glacier monitoring, and flood mapping. Deep learning algorithms from Aventior can detect apartments, houses, industrial buildings, and sheds in satellite images. And Orbital Insight’s truck detection algorithm can be used to track population movements for preparedness, evacuation, and return post-event.
Suffice to say, the range of environmental and socio-economic trends that can be examined using satellite imagery make space technology vitally important for climate change planning and mitigation. With some additional processing, spatial data can provide governments and businesses with the precise, cost-effective, and timely guidance they need to adapt to the effects of climate change.