ESA releases multi-year biomass maps to keep tabs on climate change

Tracking vegetation biomass change plays a crucial role in understanding the carbon cycle. And quantifying the global carbon cycle is essential for monitoring the numerous changes affecting our planet – especially those arising from the burning of fossil fuel and land-use change. This is why, as part of its Climate Change Initiative, the European Space Agency (ESA) has been actively researching vegetation biomass changes around the world.
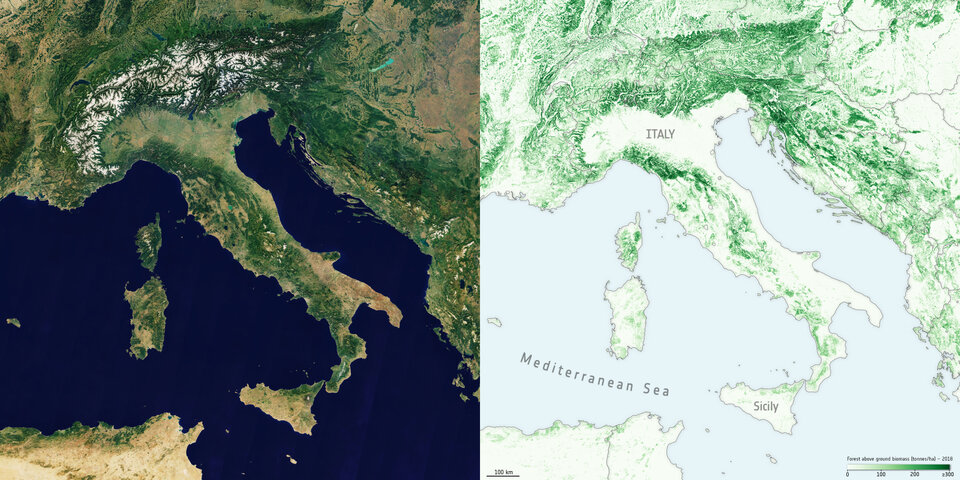
Today, ESA has released a series of new maps that provide a global view of the above-ground biomass distribution and spatial density over three separate years – 2010, 2017, and 2018.
These maps, provided at a 100 m resolution, have been created using a combination of satellite data from the Copernicus Sentinel-1 mission, Envisat’s ASAR instrument, and JAXA’s Advanced Land Observing Satellite, along with additional inputs from other Earth Observation sources.
The work, however, is far from finished. You cannot quantify the biomass changes over the last decade simply by subtracting the current maps. Since the data has been captured by sensors of different generations under different missions, the issue of temporal consistency between the different years still needs to be addressed.
The map of Italy on the right shows the above-ground biomass data from 2018. The optical image on the left shows the same view of Italy and the surrounding countries. Credit: ESA
For this, the research team is actively working on integrating additional low geometric resolution data streams into its algorithms. The new data could include the L-band vegetation optical depth from ESA’s Soil Moisture and Ocean Salinity satellite as well as scatterometer data from Eumetsat’s Metop satellite.
According to the team’s science leader, Shaun Quegan, “Combining these new data is anticipated to increase the consistency of these high-resolution maps, and move a step closer towards tracking changes and direct estimation of gross gains and losses of above-ground biomass at scale.”
Then again, vegetation biomass is a crucial ecological variable for understanding the evolution and potential future changes of the climate system, on a local, regional, and even global scale. And even in their current form, the maps could still allow scientists to undertake trend analyses, such as understanding the impact of regional climate phenomena such as El Niño on biomass dynamics.
Interestingly, ESA plans to launch a new Earth Explorer Biomass mission in 2022. This mission is being designed to provide, for the first time from space, P-band synthetic aperture radar (SAR) measurements to determine the amount of biomass and carbon stored in forests. The mission will also have an experimental ‘tomographic’ phase that would provide 3D views of the earth’s forests.
Did you like the article? Read more and subscribe to our monthly newsletter!

#Data source


Next article
How organizations use satellite data to enable transparency in greenhouse gas emissions
Editor’s note: This article was written as part of EO Hub – a journalistic collaboration between UP42 and Geoawesomeness. Created for policymakers, decision makers, geospatial experts and enthusiasts alike, EO Hub is a key resource for anyone trying to understand how Earth observation is transforming our world. Read more about EO Hub here.
To prevent catastrophic global warming, the rise in global average temperature must be limited to 1.5 degrees Celsius. This is the threshold the Intergovernmental Panel on Climate Change (IPCC) has defined as safe, and this is why it is necessary to achieve carbon neutrality by the middle of the 21st century. The goal is written into the Paris Agreement, signed by 195 countries, including all EU member states. According to this agreement, the signatories are obliged to make rapid reductions to greenhouse gas emissions.
In addition, in December 2019, the European Commission presented its flagship ‘Green Deal’ plan, which aims to make Europe climate neutral by 2050. All countries’ actions will be verified through the European Climate Law, which establishes climate neutrality as a legally binding EU goal—a challenging task, given the lack of up-to-date, reliable information about where pollution comes from. Currently, most information on greenhouse gas emissions is based on years of data provided by the emitters themselves. In light of this situation, several organizations and start-ups have emerged with an overarching goal of mapping the sources of damaging greenhouse gas emissions in real-time.
Climate TRACE
Climate Trace is an association of non-profit organizations, academic institutions, and individuals including Al Gore, whose goal is to accelerate and facilitate climate action through independent tracking of greenhouse gas emissions (GHG). One of the main goals of Climate Trace is to reveal all individual sources of CO2 emissions worldwide. For this purpose, satellite imagery and machine learning are being used to locate the major sources of harmful gas emissions. Additionally, in order to improve data quality, each team specializes in tracking emissions from a different economic sector. Interested parties can obtain free information on CO2 emissions from the Climate Trace website, where you can search by country and economic sector.
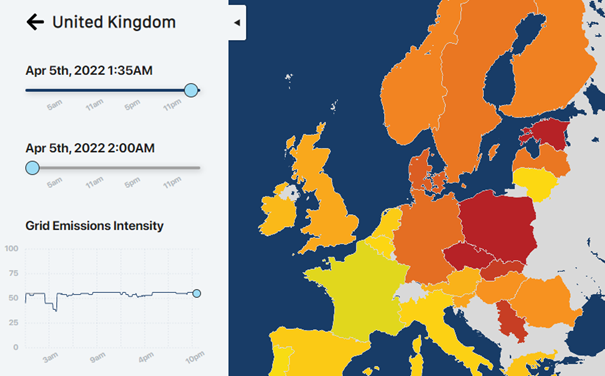
WattTime
One of the organizations supporting Climate Trace is Watt Time. On May 7, 2019, the company announced a new project in partnership with Carbon Tracker and the World Resources Institute (WRI), with the support of Google, which has committed $1.7 million to the enterprise. It intends to audit companies’ promises to reduce the release of GHG. The inspection will involve the creation of a public database that, using artificial intelligence, will track carbon emissions from all major power plants around the world.
The tracking system will make it possible to trace polluting companies, as well as enable the reduction of emissions through the application of new technologies. The project will use a global network of satellites to observe power plants from space, and harness image-processing algorithms to detect traces of emissions. The collected data will combine information from sensors that operate at different wavelengths, including using infrared measurements to detect thermal radiation near smokestacks and cooling water intakes, and visual sensors to record the presence of smoke. The company will also be able to measure pollution levels in places where governments or corporations cannot afford to do so. Data collected in real-time will be made available to the public.
The WattTime website offers an online map that shows carbon emission intensity in real-time.
GHGSat
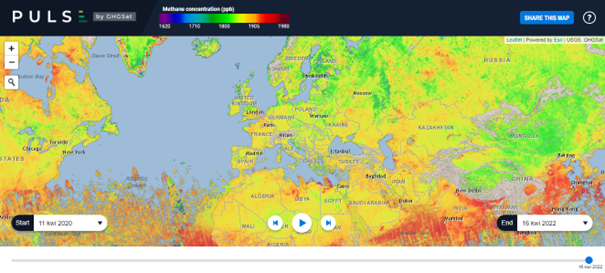
GHGSat is a company specializing in high-resolution remote sensing of greenhouse gases from space. With very high-quality data, they provide unique emissions information to governments, regulators, and investors around the world. The main objective is to preserve environmental standards. GHGSat operates a constellation of satellites, led by the GHGSat-D ‘Claire.’ Its own sensor technology allows it to track and locate even small methane leaks, pinpointing the source of emissions at the individual facility level. This involves the absorption of light of a specific wavelength, creating a kind of spectral ‘fingerprint’, individual and unique for each gas. The Claire satellite finds these fingerprints by using sunlight and the ‘brightness measurement’ of each gas to determine how much of the gas is in the satellite’s field of view at any given time.
Claire focuses on locating the two most important greenhouse gases: carbon dioxide and methane. While one of the first emissions it detected came from a hydropower plant, Claire is currently used to help industrial emitters from sectors such as oil and gas, waste management, agriculture, power generation, and mining. Additionally, the company has released PULSE, a map showing the concentration of methane in the atmosphere around the world. The map is updated every week and can be accessed for free.
In late 2021, GHGSat announced the commissioning of three more satellites, GHGSat-C3 (‘Luca’), C4 (‘Penny’), and C5 (‘Diako’), which will be launched in the summer of 2022 on a SpaceX Falcon 9 rocket, as part of the Transporter-5 mission. In addition, GHGSat has begun the procurement process for six new methane-monitoring satellites (GHGSat-C6 through GHGSat-C11), as well as an additional CO2 monitoring satellite (GHGSat-C12).
Carbon Mapper
Carbon Mapper is also actively involved in greenhouse gas mitigation. This non-profit coalition includes the State of California, NASA’s Jet Propulsion Laboratory (JPL), the University of Arizona, Arizona State University (ASU), Bloomberg Philanthropies, High Tide Foundation, and RMI. A key component of their mission is to continuously locate, track and quantify high methane and carbon dioxide emissions. This enables greater global availability, transparency, and understanding of data related to greenhouse gases. Data is collected by member organizations, and collaboration with key partners allows for the development of new strategies to reduce emissions. Carbon Mapper conducts many tests that use the coalition’s own aerial satellite prototypes, including JPL’s next-generation Airborne Visible and Infrared Imaging Spectrometer (AVIRIS-NG) and ASU’s Global Air Observatory (GAO).
The investigation of leaks in low-pressure natural gas pipelines in the Los Angeles region is an example of a use case involving the NASA-owned AVIRIS-NG instrument. Using images of methane plumes and coordinates provided by the satellite, leaks can be easily and accurately located. Many urban and rural areas have thousands of miles of natural gas distribution pipelines, and it is difficult to survey them more than once a year. This example shows how incredibly helpful the use of remote sensing can be.
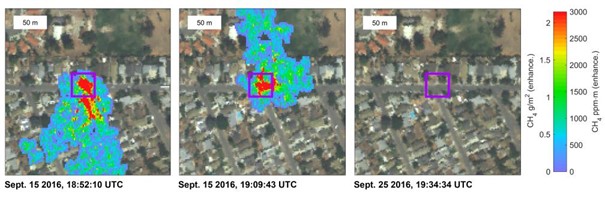
Methane Gas Leak, source: NASA/JPL-Caltech
Access to the data
All the companies and organizations listed here emphasize the importance of monitoring and controlling the current rate of greenhouse gas emissions, and they couldn’t do this without the use of satellite data. Many use data from their own satellites (or collaborators), but as the drive to avert climate disaster becomes more urgent, greater accessibility of data is becoming increasingly relevant—hence the importance of geospatial platform UP42, which was created to solve the problems of limited access to data collected from space and the enormous costs that come with acquiring it.
Conclusions
As mentioned previously on geoawesomeness, access to data is critical, and is still one of the key barriers related to the wide use of satellite data for GHG-related challenges. Democratizing access to such data is of the utmost importance—and the role of satellite data providers such as UP42 cannot be underestimated. The primary goal of such platforms is to better facilitate the access and use of satellite data, making it possible to analyze, build, run, and scale geospatial products.
The activities of the organizations detailed above enable decision-making bodies to make the most effective actions in caring for the environment, but equally importantly, they help to increase the awareness of society in general. As a result of their innovation, we can hold onto the hope of achieving our goal: emissions neutrality by the middle of the 21st century.
Did you like the article? Read more and subscribe to our monthly newsletter!