
Lets make you excited... Do you want to push your revenue line? Who you are, in profession? Agronomist, climate scientist, environment specialist, urban planner, politician or travel planner? What sort of data/information you need? information on crop health, temperature change, ground water availability, city growth, public happiness or weather? Name your data Earth Observation System (EOS) will provide you that data for free for as many time stamp as you need. I am not kidding. this is true. isn’t it awesome? whatever we are talking about; Land or ocean, surface or underground, city or forest, environment or agriculture, climate or weather we need Earth Observation information or we can push the revenue earning range beyond our expectation with the help of EO data or just by using EO data. That’s what I do in profession.; Earth Observation (EO) data turning and tuning for increasing revenue.
Now, let’s make you push from the top of the hill to the canyon. So, EO data is freely available and anybody can make use of that but what is the catch? Being a Remote Sensing (RS) and Earth Observation System (EOS) lover, I always became excited whenever I thought of freely available data and what I can do with that! but my excitement started to faded away when I started to dig deeper; when I wanted to implement my mental business case, bookish theories into practice; turning and tuning data into information for revenue generation. There are data and you can download it, its true but it’s also true that there are several kind of sensors and for several sensor, several kind of geometric, radiometric or atmospheric correction parameters and that also varies widely across the data provider. I just go mad when I think of several data type, processing, conversion and calibration parameters. The situation become more ugly when after reading 1000 page you don’t get the answer you are looking for; meta-data.
Last few months I was trying to automate a simple system which will provide me Near Real Time (NRT) crop health and weather profile information and compute yield prediction (automatically) everyday. When I though about it, it seemed quickly doable. I though it would take few months but when i started to realize it, just to find, write EO data processing algorithms and to automate the process, it took a couple of months. The catch there was about data accuracy question, efficient processing algorithms because we are talking about huge amount of satellite data processing, physical machine capacity and so. In this blog i am going to provide a simple guideline on where to start if you intended to do something like I did and some other info might be helpful if you are an EOS/RS personal:
DON’T START WITH DOWNLOADING EO DATA:
when you think about satellite data, usually pop up in our head is what are the possible data source? I would say, don’t worry about the data source, it’s every where. In fact you will find a couple of providers for same data. Next intelligent question could be how do I process the data? That’s an authentic question and oh! Boy, here you have to invest huge amount of time. Here are some tips just to save some of your time:
At the very beginning, before you start downloading sat data, research about three things: 1) mission/satellite platform 2) sensors/instruments 3) data format/meta-data, which fits and serves your purpose. A bit detail…
a) for an example what instrument/s you want to use and for what purpose? You want to use MERIS, ATSR, AATSR, SAR, MODIS, AVHRR, Aquarius, SeaWiFS, OCTS, HICO or SPOT ? If you are planning to do temporal analysis please, research on the sensor health over the satellite life time. You also might be interested in combining several sensor data for increasing the data availability. In that case study about the sensor to sensor spectral relationship models. And most importantly pay special attention on literature regarding quality, availability and authenticity of the data. So, now you have chosen your sensor .
b) in the next step check which mission/platform hosts that instrument/s because missions are handled by different institutions/groups/providers and based on the providers the data format, processing parameters, calibration algorithms, data delivery policy etc. varies. Besides, if you require near real-time data, you might need different level of processing and have to deal with different method of data delivery system. If we are talking about huge amount of data then the best way to look for providers with https/http/ftp service and you might write a little script to automate the download process. Any way, after above mentioned judgment, now you have found your favourite provider.
c) Meta-data research; I would say the most important part of EO data research. Know details about data format (i.e., netCDF, ERS, HDF, CEOS, METOP, GeoTIFF, HDF5, CF etc.), data type (byte, float, 16-bit, 8-bit etc.), spatial reference system (sinusoidal, UTM, GCS, matrix etc. ), spatial or temporal binning process, radiometric correction or atmospheric correction parameters, TOA radiance or reluctance estimation parameters, quality flag availability, pre-processing algorithms, naming conventions, no data flag, layer origin/extent etc. Because satellite data processing tools (you have/know), requires several kind of meta info and you want to make sure you have all the meta information, before you start coding. After fulfilling all these three steps, now, you are ready to download satellite data and start designing/developing processing algorithms
NOW, a little resource help for the Earth Observation System (EOS) specialist or Remote Sensing (RS) Specialist. I think, EOS/RS specialist ‘s efficiency/cost highly depends on two things. Sound knowledge about remote sensing system and knowledge about available libraries/binaries in the market and knowledge about their usage. For an example Geospatial Data Abstraction Library (GDAL) library is the one of the most awesome creation in the arena of EO data processing. It just making RS specialist’s life so easy and comfortable but there are also some other libraries which can be integrated together with GDAL using python of shell script and can provide high level of efficiency and atomization with just few line of coding. Here I am providing some information about most powerful and efficient libraries for RS personal. Originally these libraries were developed to facilitate the utilization of image data from several freely provided EO sensor data such as MODIS, AVHRR, AVNIR, PRISM and CHRIS/Proba etc. Various data and algorithms are supported by dedicated extension plug-ins.
1. pyModis: is a Free and Open Source Python based library to work with MODIS data. bulk download, parse, multiparse, mosaic, conversion etc.
2. MODIS Reprojection Tool (MRT): mainly for projection or reprojection and format conversion. besides it also good for resampling, Mosaic,Datum Conversions, Spectral or Spatial subsetting, Pixel Size, Bounding Tile Solution
3. MRT-Swath: mainly for Swath-to-Grid Conversion. its also includes functionality like spectral subsetting, spatial subsetting, map projection, resampling, and format conversion etc.
4. Land Data Operational Products Evaluation (LDOPE) Tools: summary statistics, histogram, Top of Atmosphere (TOA) reflactance conversion, range estimation, metadata handeling, spatial or temporal binning etc.
5. BEAM Earth Observation Toolbox and Development Platform: BEAM is an open-source toolbox and development platform for viewing, analysing and processing of remote sensing raster data.
6. Seadas: is a GUI based software for different level spatial and temporal binning, binding, mapping . It also have libraries to call in shell environment and automate processing while we need to process bulk amount of data. with recent Seadas release they have accommodated the BEAM libraries like Graph Processing tools. It also can take good care of multilevel processing with tools like band maths, binning, collocate, EM cluster analysis, K means cluster analysis, Statistics etc.
One point, before I finish; it’s about the programming capability of EOS/RS specialist. This question being asked several time. What language should an RS personal should learn? I have read several blogs and my understanding is the answer varies widely based on the community and interest in RS. But my experience tells, the best thing to learn is shell scripting and python together. Because this fits comfortably with most the available technologies in the market. Its easy and efficient. Some might argue that C++ or Java (full fledge, higher level programming) is better. I don’t disagree with them. They are right in terms of efficiency (means this full fledge programming language provide faster processing speed). But there are also development like CPython which covers that efficiency question very effectively. So still, I would suggest to think Pythonic way and learn shell script and have good knowledge about available geospatial libraries. You will do just great.
FEW RECOMMENDATIONS:
- for Academics: RS educational program should incorporate more detailed courses on available sensors/platforms/meta-data. And to provide courses on available libraries in the market. It will help us stop redoing same task or developing same program over and over again. Adopting BEAM in SeaDas would be a grate example for that.
- For Researchers: There should be a comprehensive research and grade available technologies in the market which will tell us about the availability, accuracy and performance of the systems that will commercialize the system efficiently. And will also provide a base line to track the developments. That will also save time for developers.
- For Employers and Employee: For those who love RS/EOS, know about Earth Observation Systems, theory and Physics very well, before you start processing satellite image. This is very important. Everybody can calculate NDVI but while calculating if you did not considered the RS theory very well, there is a higher chance that you will make mistake and that mistakes is almost untraceable if you are working on integrated system.
- For Geo-spatial Programmers: I dedicated a paragraph on that but just to conclude learn python and shell programming and have good knowledge about libraries/binaries and keep tack on developments.


#

Next article

Europe’s first satellite for Copernicus (European Earth Observation Program, formerly known as GMES – Global Monitoring for Environment and Security), Sentinel-1A, is almost prepared for its launch on 3 April 2014 at Europe’s Spaceport near Kourou in French Guiana, an overseas department of France. The satellite is going to be carried on a Russian Soyuz rocket, which proofed to be one of the most reliable launchers with more than 1700 performed manned and unmanned missions and is the workhorse of Russia’s space program.
The Sentinel 1 mission of ESA consists of a pair of radar satellites, Sentinel-1A and 1B (to be launched at the beginning of 2015) operating in the name of Copernicus program in order to monitor natural resources and be prepared for disaster response. The radar satellites will scan the Earth’s surface with a C band SAR (synthetic aperture radar) implying a wave length of approximately 6cm, which means that dielectric objects of a size of 6cm or more can be captured. Consequently, clouds can be penetrated by C band radar rendering the Sentinel 1 mission independent of weather conditions, day and night time.
Radar interferometry (information on distance between sensor and surface by extracting phase differences) and polarimetry (validating the backscattered signal) enable a broad use of applications:
Sentinel’s radar will routinely monitor shipping zones, map thickness and types of sea ice, monitor marine environment, provide information on winds and waves for marine traffic, track changes in the way land is being used and monitor subsidence. In crisis situations, it will be used for rapid response to disasters such as floods and earthquakes.
Sentinel-1A satellite will circle the earth at an orbit of 700km passing the poles and therefore generating South-North directed image stripes. Depending on the mode, the satellite will cover a range between 80 and 400km to the side. The four used modi will be (also see figure at the bottom):
1. Strip-Map-Mode: 80 km swath, horizontal resolution of 5m
2. Wide-Swath-Mode: 250 km swath, h. resolution of 5×2 m
3. Extrawide-Swath-Mode: 400 km swath, h. resolution of 20x40m
4. Wave-Mode: sampled images of 20x20km at 100km long orbit alternating into 2 incidence angles, 5x5m resolution (TBC)
The very good news: Sentinel-1 data are going to be publicly available! As far as I know it is the first time that radar data are going to be freely availably!
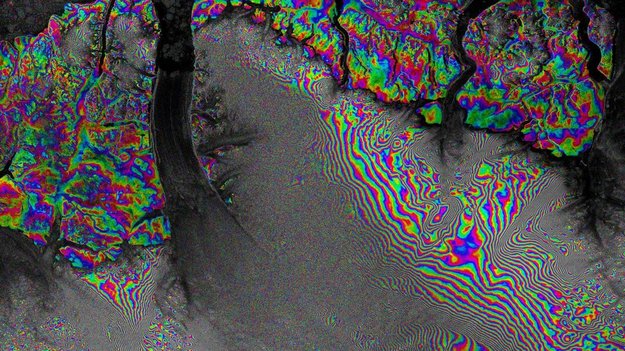
Radar interferometry is powerful to reveal changes of land surface such as subsidence, risings or shifts. The image at hand shows the Petermann Glacier (Greenland) within a time frame of 24 days. The rainbow coloured areas entail zones of subsidence or risings. One colour phase (e.g. from red to red) refers to the absolute number of vertical land surface movement and is half of the radar wave length. Accordingly, the shifts at the middel and bottom right of the image were greater than in the upper or left side. Source: ESA
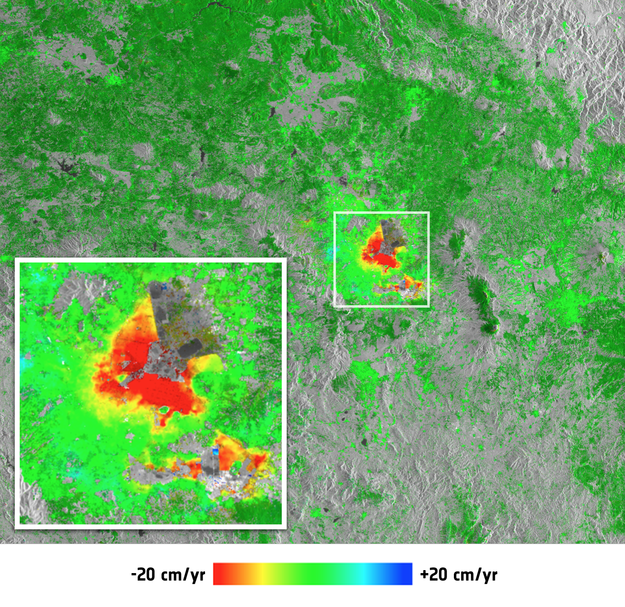
Surface subsidenc in Mexico City. Source: ESA
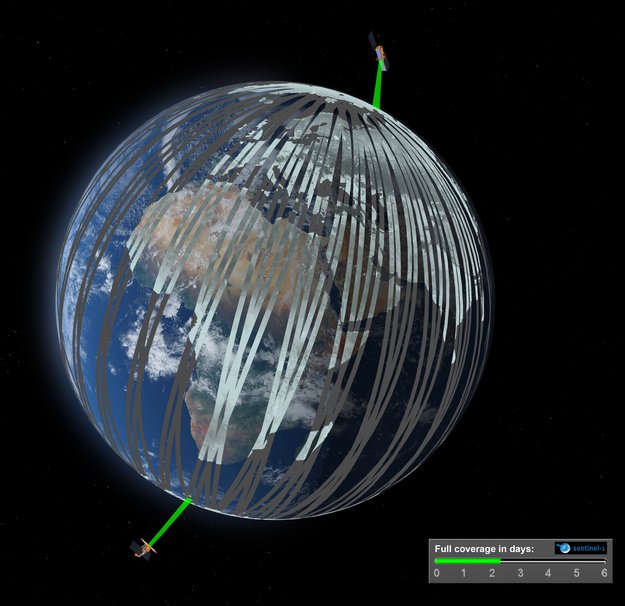
Planned constellation and orbit of Sentinel-1A and 1B: The satellites will pass the poles producing South-North directed image stripes.
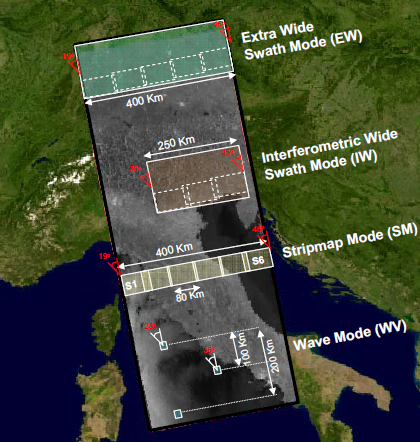
Swath modes of Sentinel-1A and 1B.
Info: ESA