

Three moths ago nobody would have considered a shut down of transport, local businesses and industrial facilities as a consequence of the fight against the corona virus possible. Authorities all over the world have come up with plans to delimit and cease daily activities to prevent the corona virus from spreading further. This has led to quarantine regulations in China starting in February and many European countries following in March.
Highly perceptible for everyone is the reduction of public transport and as a consequence of the limitations to daily life also the private one. On the road from Klagenfurt to Munich last Saturday I counted less than 15 private cars on a stretch of around 350km! Airlines are reducing or ceasing regular flights, among them Emirates (cancellation of all passenger flights by 25th March), Etihad (cancellation of all passenger flights by 25th March), Ryan Air (grounding of most flights by 24th March), Lufthansa (operating return timetable mostly), Austrian Airlines (cancellation of all passenger flights by 18th March) and many more.
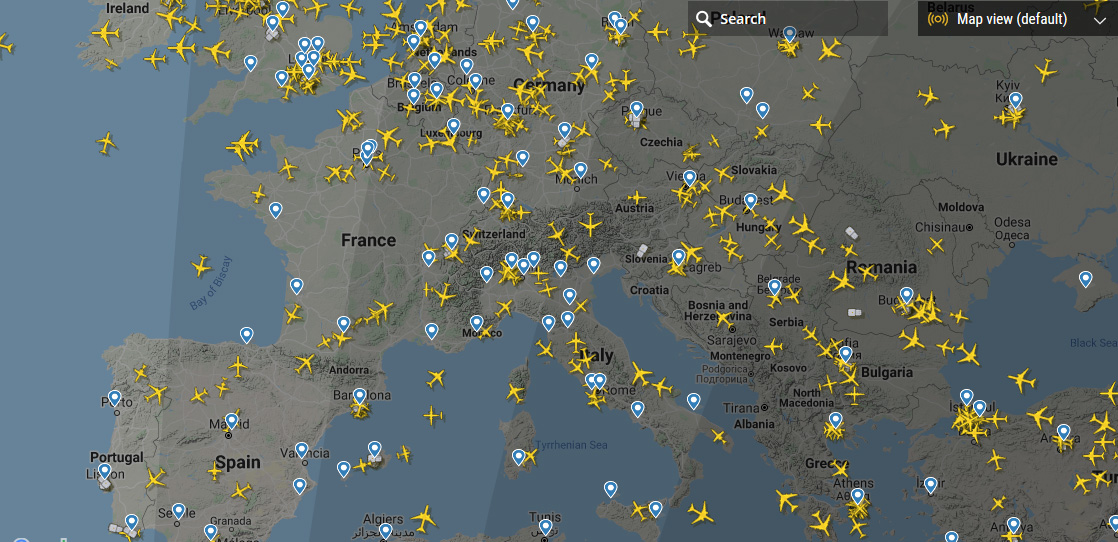
Screenshot showing flights over Europe on 26th March at 19:45. The flight traffic is significantly reduced compared to the regular flight traffic. Source: Flightradar24
The established regulations have an effect on the quality of air: NASA and ESA pollution monitoring satellites have shown a significant reduction in atmospheric nitrogen dioxine (NO2) over China in February 2020. – NO2 is created by burning fossil fuels, for instance in combustion engines or power plants, which is linked to the initially mentioned actions. It is highly poisonous and in the United States classified as an extremely harzadous substance (Section 302 of the U.S. Emergency Plannning and Community Right-to-Know Act (42 U.S.C. 11002)), causing respiratory symptoms and diseases (source).
In the figure below, the left panel shows the concentration of NO2 across China from January 1 – 20 before anti-corona virus actions taken. The panel on the right side exhibits NO2 concentrations across China in the time of February 10 – 25 during the quarantine. The comparison reveals a significant drop in NO2 over wide parts of the country. According to Fei Liu, air quality researcher at NASA’s Goddard Space Flight Center, such a dramatic drop-off over large areas was never observed so far (source).

Air quality over China – Nitrogen dioxine measured by TROPOMI instument on Sentinel-5P satellite over China between 1 January and 25 February 2020. Source: NASA Earth Observatory
The drop in nitrogen dioxine also coincides with the Lunar New Year festivities in China (last week of January until early February) and parts of Asia. Past observations reveal that air pollution during this time usually sinks as a consequence of closing factories and businesses. However, this years’s NO2 drop is more than a “holiday effect”, which is also undermined by the numbers of NO2 concentrations compared to the last years.
Simulation videos about the change of nitrogen dioxine concentration and air quality over China and most recently also in Northern Italy can be observed by clicking the corresponding links. The videos are contributed by ESA.
EO satellites
The presented NO2 concentrations were measured by the Tropospheric Monitoring Instrument (TROPOMI) on board of the Copernicus Sentinel-5P satellite, operated by ESA.
Sentinel-5 Precursor satellite is the first of atmospheric composition Sentinels and was launched on 13th October 2017. It’s life time is planned to last seven years. To obtain an impression about the instrument’s capability, the measurements made by TROPOMI and offered as Level-2 products are listed as follows: UV aerosol index, aerosol layer height (mid level pressure), carbon monoxide (CO), cloud (fraction, albedo, top pressure), formaldehyde (HCHO, total column), methane (CH4, total column), nitrogen dioxide (NO2, total column), ozone profiles, sulphur dioxide (SO2, total column), ozone (O3, total column), troposheric ozone (troppsheric column).
The Ozone Monitoring Instrument (OMI) on board of NASA’s Aura satellite has made similar measurements as the one shown by ESA’s Sentinel-5P.
One man’s joy is another mans sorrow
The corona pandemic has shown that dramatic actions taken by authorities can be realized within short time. Some of the taken actions are climate relevant and have a positive impact on the environment such as air quality within short time. This is undermined by the presented example of nitrogen dioxine concentration recorded by the Sentinel-5P satellite.
This pandemic makes us aware that we are adaptable to changing conditions and able to take actions in order to delimit the spread of a virus and in future – hopefully – also to reduce the effects of climate change.
If you enjoyed this article, read more and subscribe to our monthly newsletter!

#


Next article

Imagine it’s the early 80s. You meet one of your geeky friends, and he tells you about this fantastic new tech he’s working on:
— So, we’re using a number of satellites in the orbit which allow us to give you your exact position on Earth at all times. We call it GPS.
You lost him right about when he mentioned “satellites” and “the orbit”, but you respond politely, unaware of all the tech goods to come:
— But, I know where I am and how is that different from simply using a compass and a map?
The conversation goes on, and you mostly forget about it the next day. Decades pass. 90% of the apps on your beloved smartphone use location information, and you meet your friend again in the adolescence of the 21st century:
— Now we have this satellite system, that allows us to take high-resolution images of any place on Earth every day!
Although you still shiver on the sound of the word “satellite” and the only resolution you know is from the “4K” label on your TV, you try to respond to the best of your tech capabilities:
— Right… so how is that different from Google Maps?
Satellite remote sensing vs. The Mainstream
Forgive me, for the potentially incorrect assumption my dear reader, but in that story above, you’re the mainstream. We, the EO sector, are this geeky friend of yours in the second part. The conversations like this happen frequently, and that’s what a lot of us struggle with these days.
Although we love to share what we do with everyone, our responsibility is to first communicate and educate the government, institutions, and businesses in every possible domain to take advantage of satellite remote sensing to improve their services. Hopefully, as a consequence, you’ll be positively impacted directly or indirectly without even noticing it.
However, this hardly is reaching the mainstream on the GPS-scale, as mentioned earlier, and the biggest obstacle holding EO from achieving that is still – the system. I don’t mean “The system” as a something-you-shouldn’t-trust way. I mean the earth-imaging satellite system.
The system
Let’s forget for a moment about different providers and which satellite belongs to whom because with the work done by spectator.earth and many others it will all be gone in some lets-hope-not-so-distant future.
We currently have around 800 EO satellites in orbit, with many more scheduled for launch in coming years. If everything goes as planned and some sudden, unexpected event doesn’t strike the global economy (yes, I wrote this beginning of March 2020), the number of the satellites should at least double in the next decade.
Different resolutions, different orbits. As far as frequency is concerned, if we exclude geostationary satellites, you can image any area on our planet multiple times a day with decent resolution. However, even if we successfully integrate them all, it’s still hardly a constant stream of information which is what we’re all used to these days. If we want an average person to take advantage of satellite imaging, the use of it has to so frictionless and straightforward, that people can come up with applications we would never think about.
Accustomed to all other technologies that are much more real-time, people would expect from all the space-buzz words that you can pretty much monitor any area you want with centimeter accuracy at all times.
We won’t meet those expectations very soon. One because of the technology and its cost and second because of the regulations. I’m pretty sure you wouldn’t be so happy to know anyone can visually track you in real-time anytime he wants.
So, where is the boundary? Is there a technological barrier luring from the future or is it going to be a regulatory or economic one and we’ll eventually hit the wall?
Future of satellite remote sensing will be exciting, judging by the pace it’s moving now, but depending on the how we steer this development and regulations enforced to attenuate its progress it may never reach its full mainstream potential.
If you enjoyed this article, read more and subscribe to our monthly newsletter!