

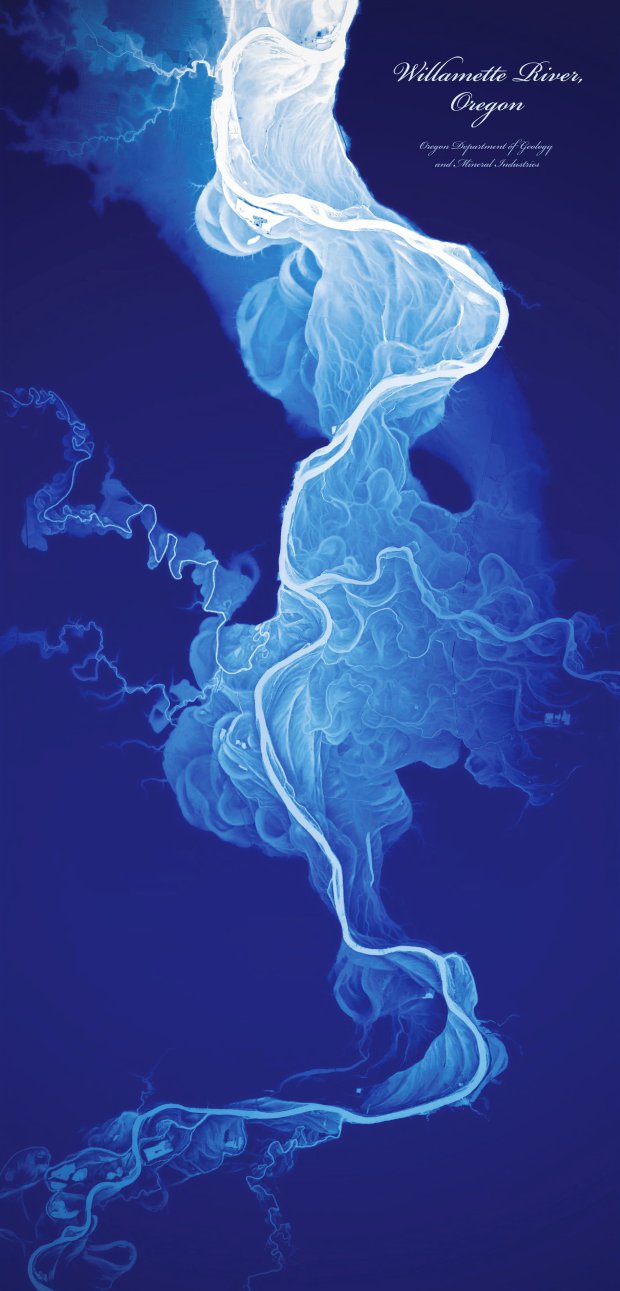
Every now and then you might come across something so beautiful that it takes your breath away. When you’re a GeoGeek it typically includes some sort of maps. It happened to me today when I accidentally saw this map. It’s amazing.
The visualisation has been created by a cartographer Dan Coe, based on the Lidar data captured by the Oregon’s Department of Geology. The image is a digital elevation model of the Willamette river valley, where the elevation heights have been represented by a range of colors from white in the lower elevations to dark blue in the higher elevations. Actually the elevation range is only 50 foot (15 meters) but the results are amazing. The map shows the history of how the river channels were changing in the course of the last 12,000 to 15,000 years.
Beautiful.

#


Next article

For thousands of years, mankind has called Earth our home but ever since we gazed upon the stars, we’ve had a yearning for those unknown worlds and distant stars! It’s true that there is no place like home but there is no denying that we are meant to explore the depths of the universe!
“As for me, I am tormented with an everlasting itch for things remote. I love to sail forbidden seas, and land on barbarous coasts.” ― Herman Melville, Moby-Dick
There is perhaps nothing more exciting today than the lure of space travel and no one drums up that excitement in us better than the folks at NASA!
Visions of the future
NASA had commissioned the design firm Invisible Creatures to design three posters for its Vision of the future poster series and there are simply spellbinding. Check them out for yourself!
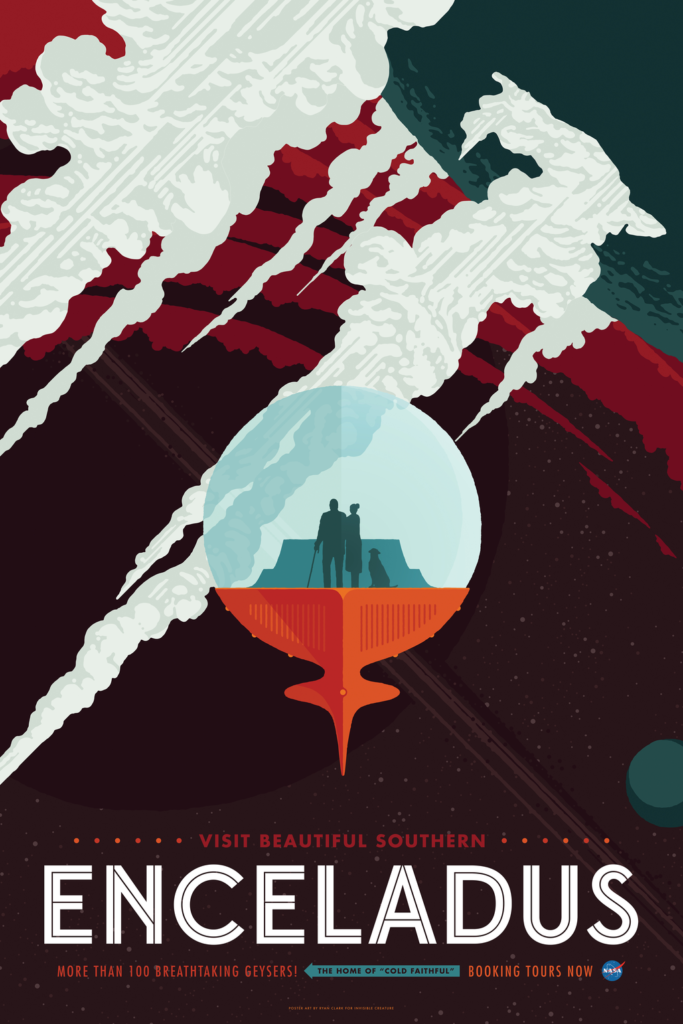
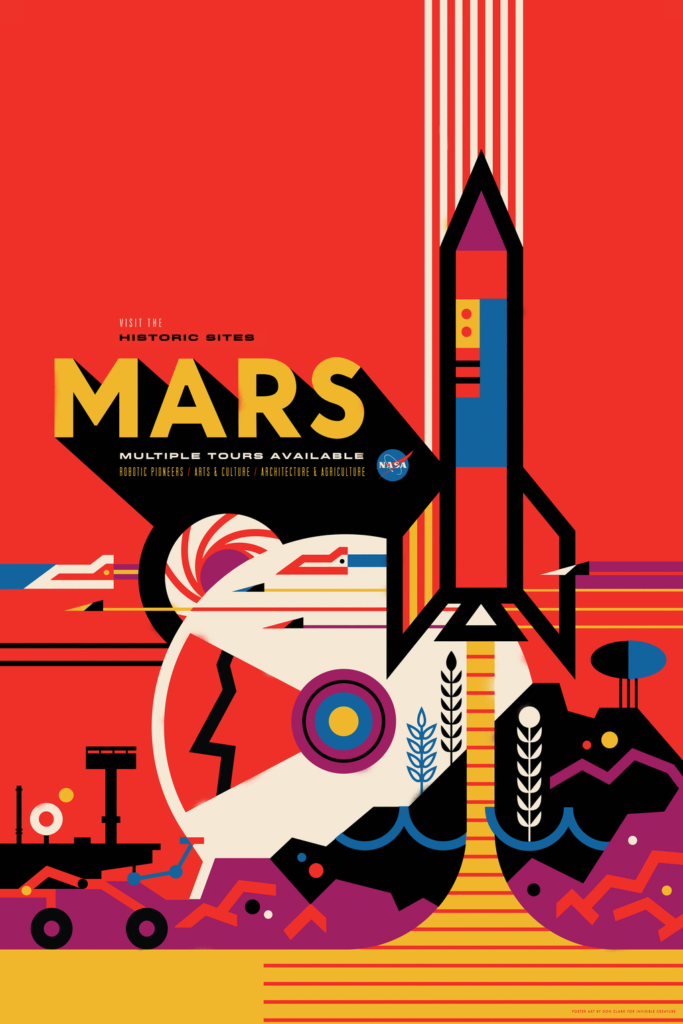
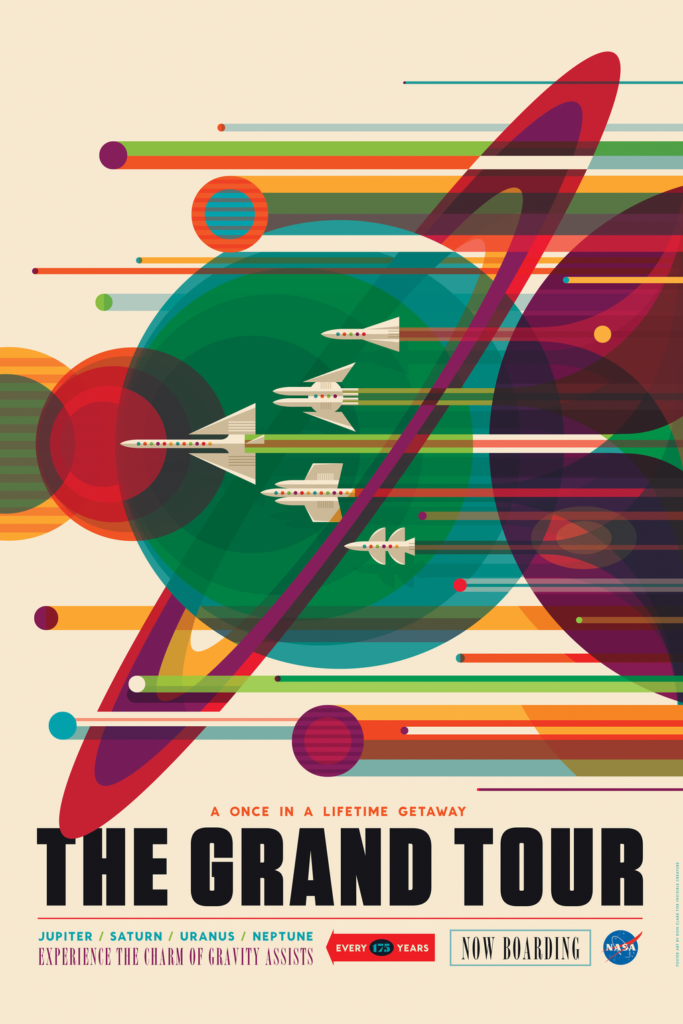
The Visions of the Future poster series now has 14 posters in total and each of them is a work of art! Here’s the link the JPL webpage – Visions of the future! If you are looking to buy the posters themselves, head to the Invisible Creatures webpage where they