
A short tale about how I wanted to buy satellite imagery and how difficult it was


I have spent over a decade in the geospatial industry and thus know a lot about how things work here but I was shocked when recently buying satellite imagery for a project. I wanted to share with you my experiences and confirm whether it was a rule or an exception.
So I wanted to buy high-resolution satellite data of a few hundred sq. kilometres over Asia. My estimated budget was under 10K USD. The project had a short deadline so I had a maximum time of two weeks to get the data.
I thought that in the third decade of the XXI century and all the marketing budgets from satellite data providers, the whole process will be as simple as finding the data, paying, and downloading the selected imagery. Apparently, the purchase process is much more difficult and it seems that in reality, nobody is interested in selling you the data!
Finding the needle in a haystack
The first challenge is already at the first step of the process, how to find the data I need? As I found out, that there is actually no data catalogues pertaining to which satellite imagery is available and where you can get it! And I realized that, until and unless you are ‘fluent’ in satellite imagery and you have time to learn from your own mistakes, there is absolutely no way around.
The situation was so ridiculous, that I decided to make an open-source project to help things out with data discovery. Here is an excel file that has a list of all the satellite data from the majority of earth observation satellite systems with resolutions and key parameters.
This list also helped me discover that, other than the key players like Airbus and Maxar, there are several smaller players that can offer me the data I need e.g. in China.
The ‘journey’ to buy the satellite imagery
My project team didn’t have much time left and thus to mitigate the risk, I asked the team to visit the website of every major satellite vendor to see what data is available and verify the purchasing processing. Simultaneously I had already discovered that there was no ‘website system’ to buy the data from the Chinese satellite companies. So, instead, I started exploring my professional network for the same.
Thus, my team started visiting the websites and online portals of Maxar, Harris, Planet, and many others. And to our dismay, no website had the option to buy the data directly. All of them would somehow redirect you to direct contact with the sales department at some point.
So, my team wrote an email to every company, stating the area of interest and other details. And after two days, only Harris replied… (and although we are a few weeks later no other vendor has yet replied to our query).
The time had really flown by and the project deadline was approaching. And soon before the conclusion of the deal, this Harris representative started sending ‘Out Of Office’ emails which pointed out to another person. And this nice guy also gave no reply as apparently there was a typo in the email address provided.
So much happened and a lot of time went into this. But by God’s grace, we hit the right spot and after another 24h got in touch with the right person.
Simultaneously, I was able to contact a few vendors in Europe that were offering Chinese satellite data. I conveyed my area of interest and signed NDAs. Soon we were talking business. But we hit another dead end because they said that it will take another two weeks to get the processed georeferenced data for my area of interest.
Although, as much as I wanted to explore this thread, I just did not have the required time. I had less than a week!
On the other hand, my team was in talks with Harris. We had agreed on the terms and conditions and the prices. Also, we received a payment link the next day. The timer was ticking and it was already 4 days to the deadline!
We were supposed to get the processed data within 1-3 business days (just in time for the deadline). After 3 days, we’ve learnt that the initial time calculation has been underestimated and we need a couple of more days. Eventually, we have received the first data after 5 days and the entire order after 7 days…
To be fair, I must admit that even though my frustrations has been huge, in the end, the communication with the Harris team regarding the delay was good and has been clearly communicated.
Conclusion
This whole experience shocked me! I have learned that there is no one who wants to sell this data. I mean, these companies have set up some really expensive infrastructure, but they’ve clearly done it with huge clients in mind. If I am not the government, military, or Google there is nobody who is interested in me. Nobody wants to sell the data to an individual project.
P.S.
While I was reading more about the topic, I came across this really interesting post by Joe Morrison. The fact that it is written from the perspective of somebody who is working inside one of these big vendors, makes it special. I recommend you read this post.
Did you like the article? Read more and subscribe to our monthly newsletter!

#Data source
Next article
Using geospatial analysis to identify where people are and understand who is being ‘left behind’

As a GIS Technician focussing on fragile and complex environments such as war-torn regions, I am constantly reminded how Geospatial tools and data play an integral part in achieving a more globally sustainable future. In particular, the UN Sustainable Development Group 2030 Agenda commitment to “Leave No One Behind” is usually in the back of my mind when thinking about geospatial for good.
The “Leave No One Behind” promise includes the steps: “identifying who is being left behind and why; identifying effective measures to address root causes; monitoring and measuring progress” (United Nations). This is a great concept, and if achieved will transform the lives of vulnerable individuals. But how is this going to be achieved when you don’t really know where the people are?
My work focuses on some of the most challenging environments, and despite the most conclusive data coming from intergovernmental organisations, there are invariably issues with accuracy, which in hindsight, raises doubts as to whether the data acknowledges where the people are with a reasonable confidence level.
I am constantly dealing with datasets that are not necessarily fit for purpose – whether the data is outdated, missing attributes, or just simply difficult to understand. However, thanks to open-sourced data now becoming more readily available, basic datasets are improving. Open-sourced datasets are fundamental for environments where there is a lack of data, or if there are time and/or budget restrictions. They allow anyone from anywhere to contribute data and to an extent improve it with their knowledge.
Take Afghanistan for example, with a population of approximately 38,041,757 (in 2019) (according to the World Bank), the country has unfortunately had more than its fair share of bad luck. Since 2018, it has been hit by several environmental disasters including droughts, floods, and freezing temperatures (Relief Web). The widespread conflict, COVID-19, and now the unknown political situation, has exacerbated their hardship, and it is only going to get worse.
Just one of those scenarios would have triggered a monumental humanitarian relief response, let alone multiple events occurring at the same time, resulting in internally displaced people (IDPs, those forced to flee their homes within their own country) and severe food insecurity, to name but a few outcomes.
The United Nations has classified Afghanistan as a “Hunger Hotspot”, where at least 12 million of the population are facing food insecurity (Reuters). This is just one of the many challenges being faced by the Afghan people, and with another drought happening right now, time is of the essence. With the food insecurity example, it is critical aid reaches those in need. But with these multiple events happening simultaneously, how are we meant to know who is affected, and then how will a complex relief operation be able to respond to help those who need it most?
In 2019, the company I work for, Alcis, were determined to help find a solution to this fundamental problem of not knowing the true location of the population in Afghanistan. Using high-resolution satellite imagery and building on work the company carried out in 2014, Alcis set out to digitise every domestic compound in Afghanistan ‘from space’. The datasets were manually created with incredible determination, and they have proved to be invaluable as there is no other population dataset as comprehensive as them.
This one single dataset can be combined with other data and used in multiple geospatial analysis tools, devising numerous datasets and further analysis layers. As stated by Muthukumar Kumar “Location data like all data can be used for more than one purpose”, which I will now explore with a few examples.
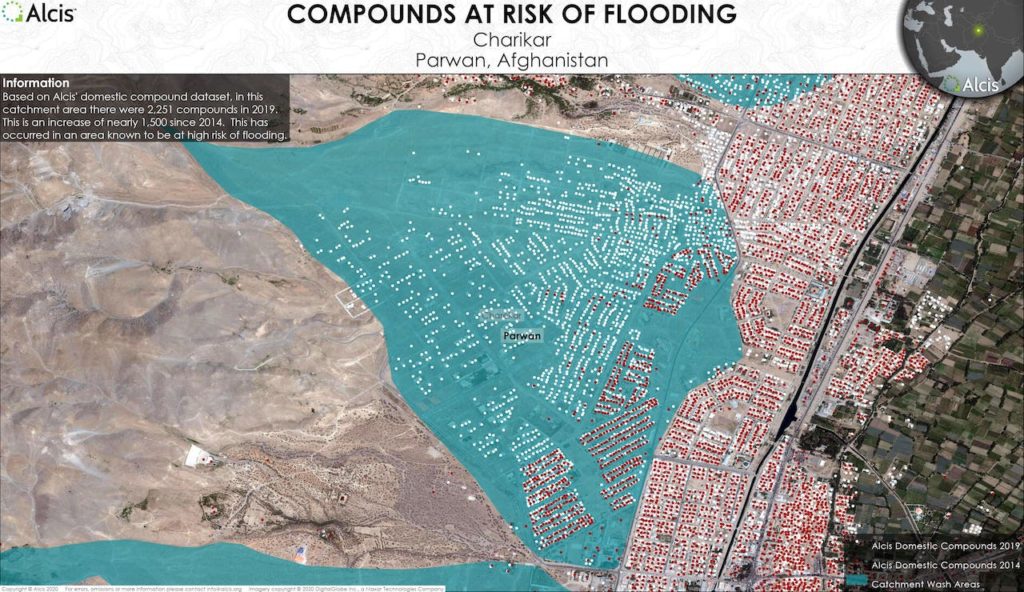
One of the most practical uses of this dataset is creating a population density layer. Population density layers can be produced at different resolutions and can provide a generic overview of identifying where the most populated or unpopulated places are in an area. This layer is also beneficial to determine flood event impacts, such as estimating those who have lost their homes and become displaced or predicting those who could be at risk from future events and mitigating impacts from this hazard.

Figure 1: Using Alcis’ compound datasets to assess the location of the population change and their vulnerability to flooding in Parwan Province, Afghanistan.
Another example of how we used the compound data was working with the Norwegian Refugee Council in response to the 2018 drought in Northwest Afghanistan. The aim was to assess the human impact of the vegetation deterioration the drought had caused, which resulted in 371,000 individuals being displaced, adding to the approximate 2.6 million IDPs already in Afghanistan (Internal Displacement Monitoring Centre (IDMC)).
The analysis involved our compound data and a crop health deterioration analysis, which involved using the NDVI (Normalised Difference Vegetation Index) of the region. The Alcis’ NDVI is derived from MODIS satellite imagery and is created using Model Builder in ArcPro, which is used as a proxy for crop health. Without the compound data, we could still estimate the areas that were impacted by the drought, but we wouldn’t be able to determine the number or the locations of individuals who were impacted.
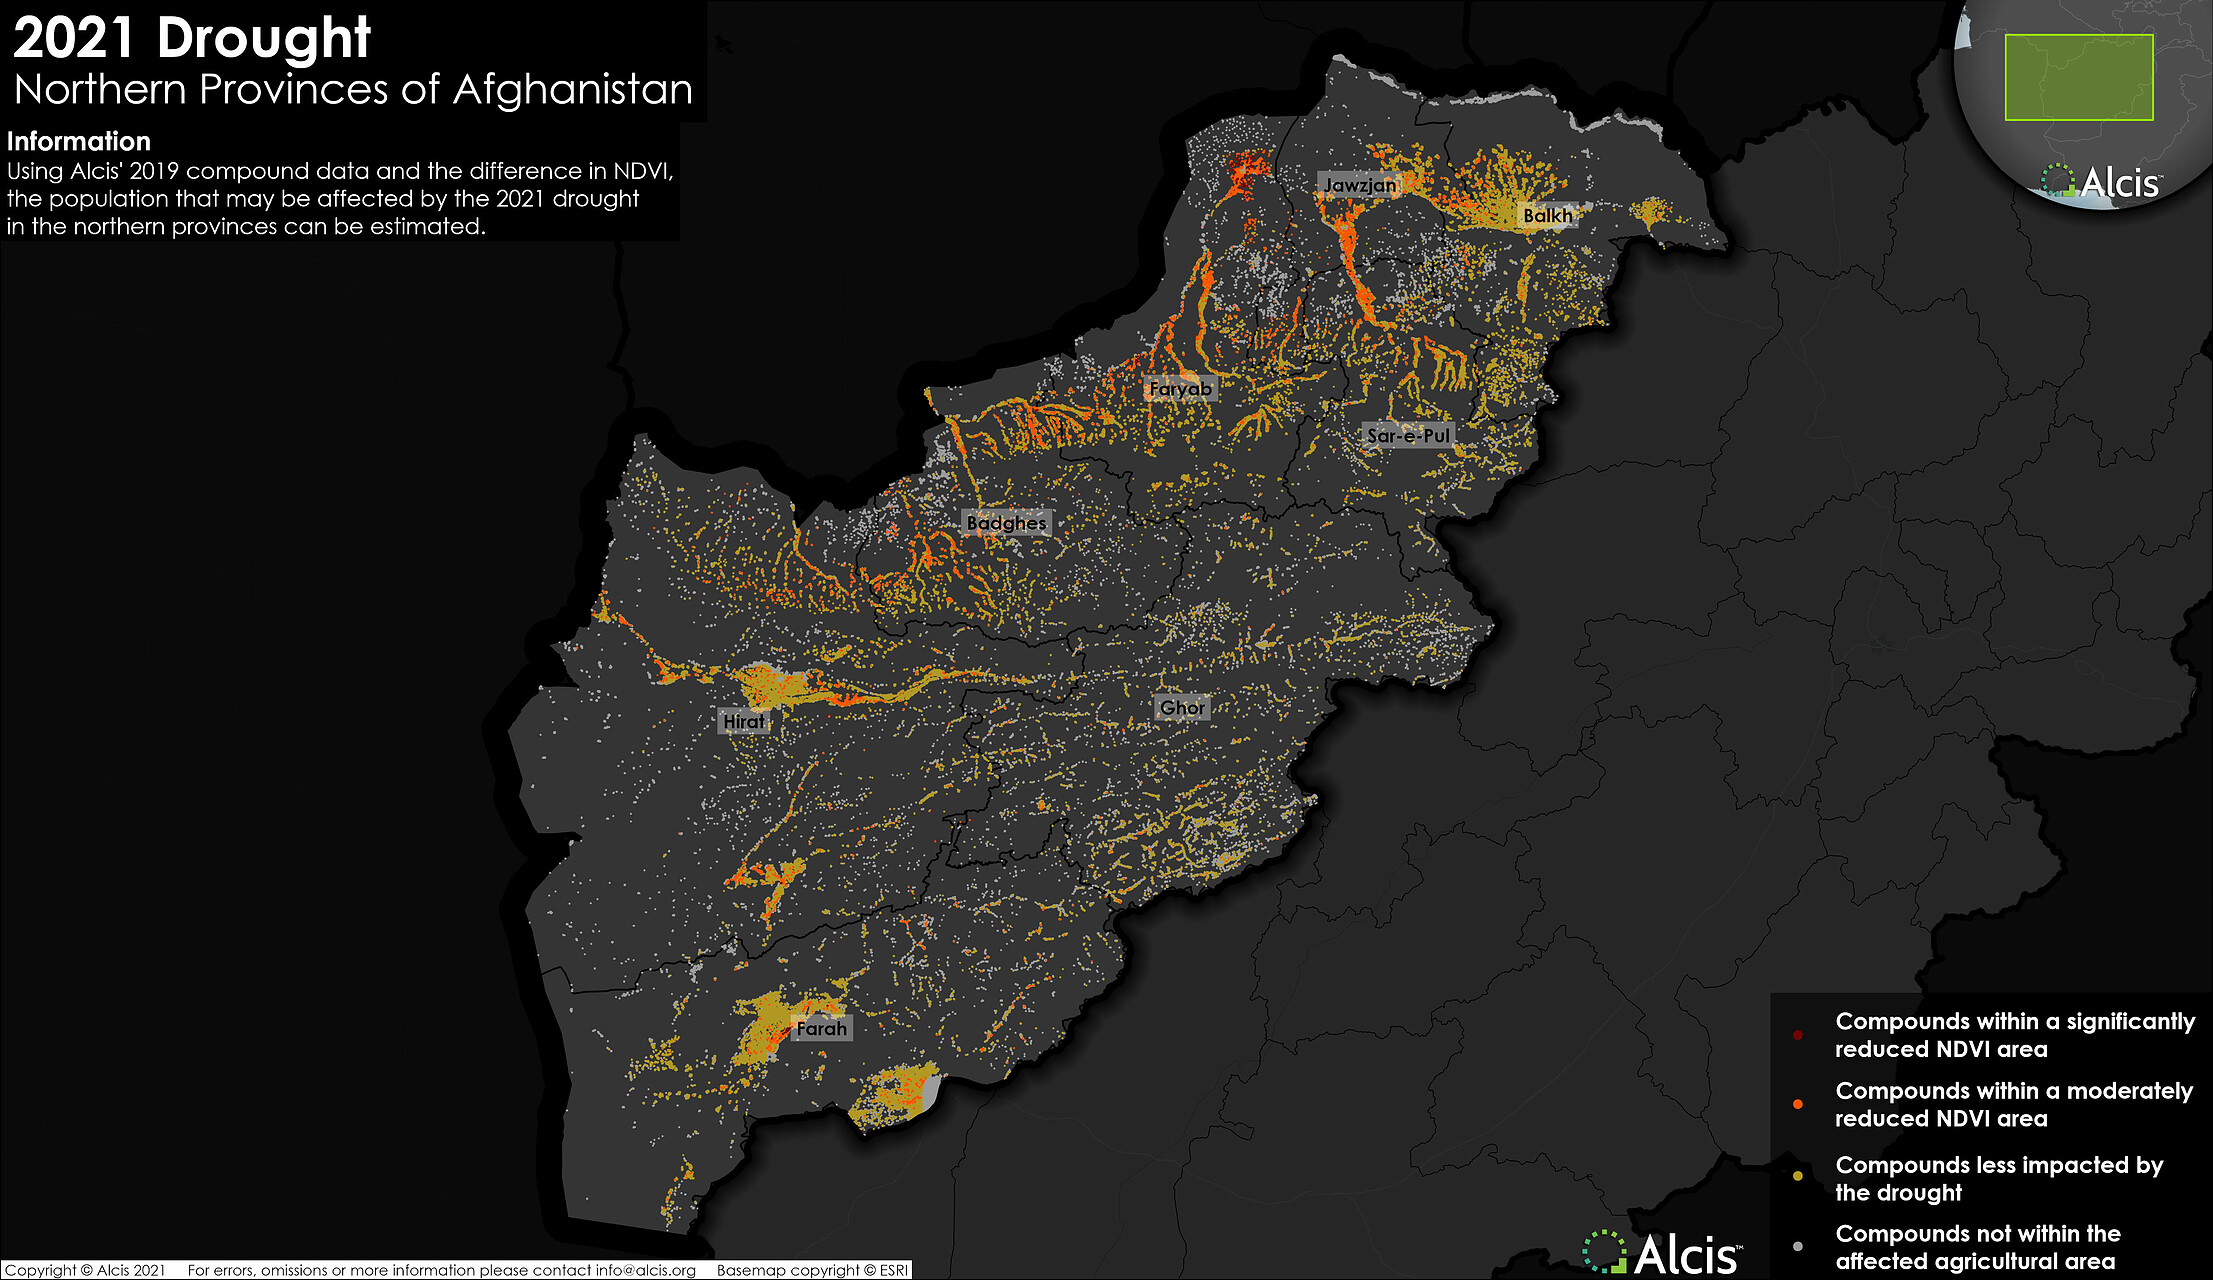
Figure 2: Using Alcis’ 2019 compounds data, to estimate those who are likely to be affected by the 2021 drought in the northern provinces in Afghanistan.
Furthermore, as we have locations of individual compounds, we can combine them with other point datasets and Open Street Map’s Road data, to use them in the ESRI Network Analyst tool. This tool can generate further in-depth analysis, as it can estimate the time and distance from each compound to a local facility (such as a hospital), as well as calculate the number of compounds within varying ranges of a facility.
This method can help establish where people could be underrepresented, by highlighting the population that cannot reach their closest facility, such as a polling station to cast their vote.
Moreover, knowing how many compounds are within a 2-hour driving range from a health facility, for example, could help the United Nations achieve Sustainable Development Goal 3 – Ensure healthy lives and promote well-being for all ages (United Nations Sustainable Development Goals). The compound data would help health clinics locate everyone in their range and provide efficient, adequate, and appropriate care to them all.
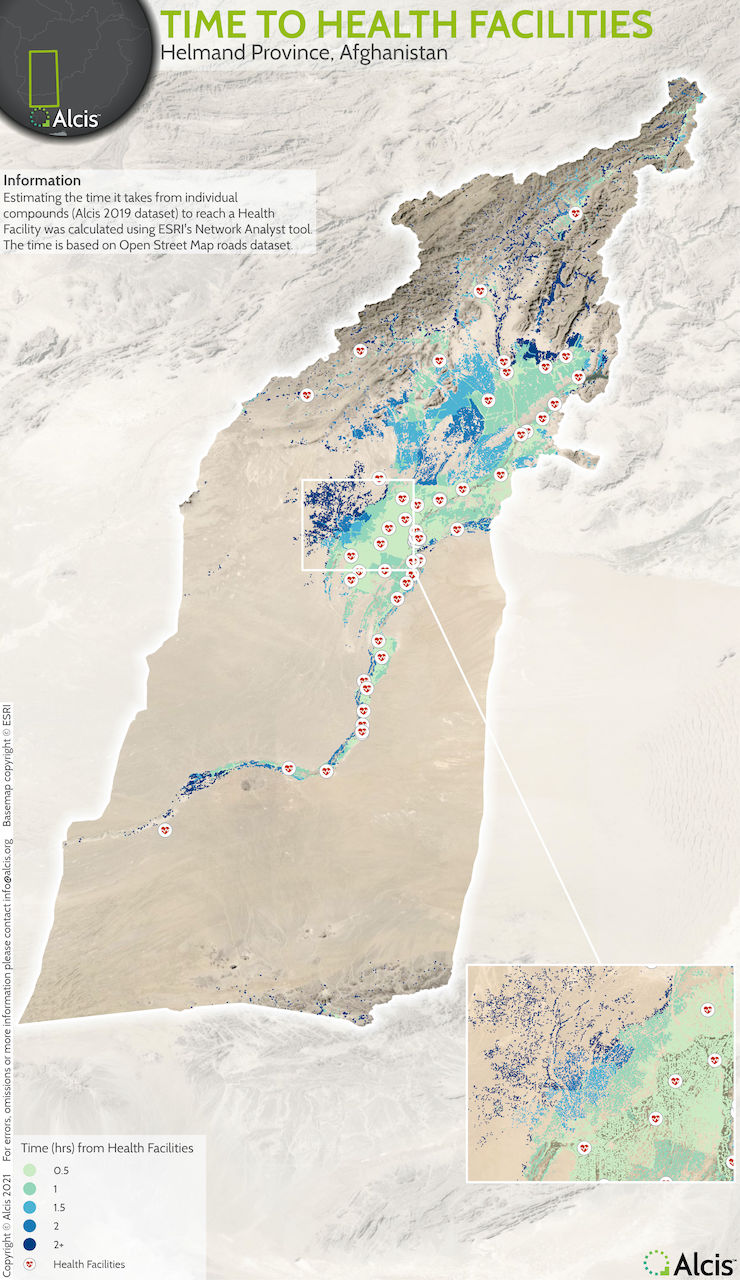
Figure 3: An example of how using Alcis’ 2019 compounds with open-sourced data, and ESRI tools can produce in-depth geospatial analysis to estimate those who may not have access to health facilities.
The current COVID-19 pandemic poses even more pressing questions that need clear answers to prevent the spread of the virus. These questions may be how many compounds are served by one health centre or is there any part of the population that is not able to reach a health facility.
UNICEF have the significant challenge of globally rolling out vaccines to children, but with COVID-19, they are responsible for the rollout of the new initiative “COVAX“, which is a co-led initiative by GAVI, CEPI, and WHO with the aim of “accelerating the development, production, and equitable access to COVID-19 tests, treatments and vaccines” (World Health Organisation). “COVAX” and many others need to locate where everyone is, not just children, in relation to facilities such as schools. Thus, using the Alcis’ 2019 compound data and the network analyst tool, the setting up of emergency vaccination centres, sending field operators to the correct locations, or other necessary approaches would undeniably ensure everyone had safe access to a vaccine.
Granted, Alcis’ 2019 compound data is only for Afghanistan, but there are examples of in-depth population location data for other regions in the world, such as the work led by the Bill and Melinda Gates Foundation. They provide open-sourced and transparent data such as their African rooftop data. But despite their data providing accurate locations, it is still not enough to determine the location of individuals that are being ‘left behind’ and need assistance elsewhere in the world.
In Afghanistan, there is an unknown element of where or if people have been relocated due to the current political situation or by any other means mentioned previously, both causing internal displacement and further international migration. In response, the challenge in the next few years for providing accurate population data for Afghanistan will be monitoring the change in movement and location. Through identifying the abandoned compounds, establishing the new locations of the resettled population, and the dynamics of IDP camps from satellite imagery, we will make sure that no one is left behind in the forthcoming years.
So what can we do?
Back to the question, how can we as GIS users, carry out “geospatial for good” when we do not actually know where the people are or may not have suitable data for our geospatial analysis? There is potential for GIS users to help solve this issue by creating a decent standard of data through various methods and using it for good. Additionally, as previously discussed, location data has multiple purposes, it is all well and good to spatially know where the population is, but in order to deliver effective analysis and results, you need to also gain an understanding of the situation. The hope is there will be comprehensive population data for those countries or regions that have limited spatial data, so policymakers, GIS analysts, and anyone else who requires the data for analysis would be able to identify where the people are (not who they are) and use geospatial technology ethically and for good.
References:
(in the order mentioned in the article)
United Nations Sustainable Development Group
Muthukumar Kumar Geoawesomeness article
Internal Displacement Monitoring Centre (IDMC) United Nations Sustainable Development Goals