
At EIXOS Economic Observatory we’ve used our fieldwork data to shed light on the current covid19 lockdown retail scenario and what has yet to come as a result of the closure of business. We do not do this to be alarmists, but because we believe that it is possible to make more accurate forecasts and make better decisions with data-driven scenarios.

covid19 impact on Manhattan retail
In the coming days, weeks and months we will be publishing a series of articles on Geoawesomeness.com that analyze the impact of confinement and social distancing measures on retail and economic activities at the street level of cities.
How does confinement and social distancing affect retail? How will it affect it in the next few months? How will our urban retail be doing in a year? What steps should be taken to revive the likely drop in business activity?
These and others will be questions that we will try to answer using data, and retail composition and retail health indicators.
We dedicated the first article of the series to evaluate the covid19 quarantine on Barcelona retail. In many aspects Barcelona and Manhattan could be considered twins. Both are based on what we refer to as a “mediterranean model of city” (as opposed to a “high street” or “main street” model) that combines retail and other commercial services on the ground level with residential or business offices on top of it. Both have significant retail in every direction, in a “grid” model. They also share a similar geographical size (around 50 km2). Both have almost 3,000 restaurants, almost the same number of convenience stores, around 1,200 Manhattan Delis vs. 1,300 Barcelona “Pakis”). And so on.
CONFINEMENT AND CLOSURES. BEFORE, DURING AND AFTER.
How do we measure the impact of retail closure?
We will do this by comparing four scenarios with each other: the pre-closure scenario, the scenario during the lockdown itself (both real and quantifiable scenarios), and two hypothetical post-lockdown scenarios, three months after the end of confinement.
In order to create the hypothetical scenarios, we suppose that certain commercial activities, due to their specific characteristics, will have problems reopening. In one way or another, all commercial activities will suffer through financial stress. However, some businesses will have to permanently close and these closures will be the most damaging.
As modeling retail closures can become a very complex calculation, which would require data on which we cannot have sufficient detail (such as debt status, actual operating costs, etc.), we simplify the model by assuming what would happen if certain categories of economic activity simply could not reopen after the lockdown.
We also establish the margins of different commercial scenarios that would lead to decay in activity. The key here is predicting when the Retail Occupancy Index (ROI) (the percentage of active storefronts with respect to the total number of available storefronts in a particular geographical area) might fall below the threshold of desertification (ROI < 80) and below the even more critical threshold of severe desertification (ROI < 70).
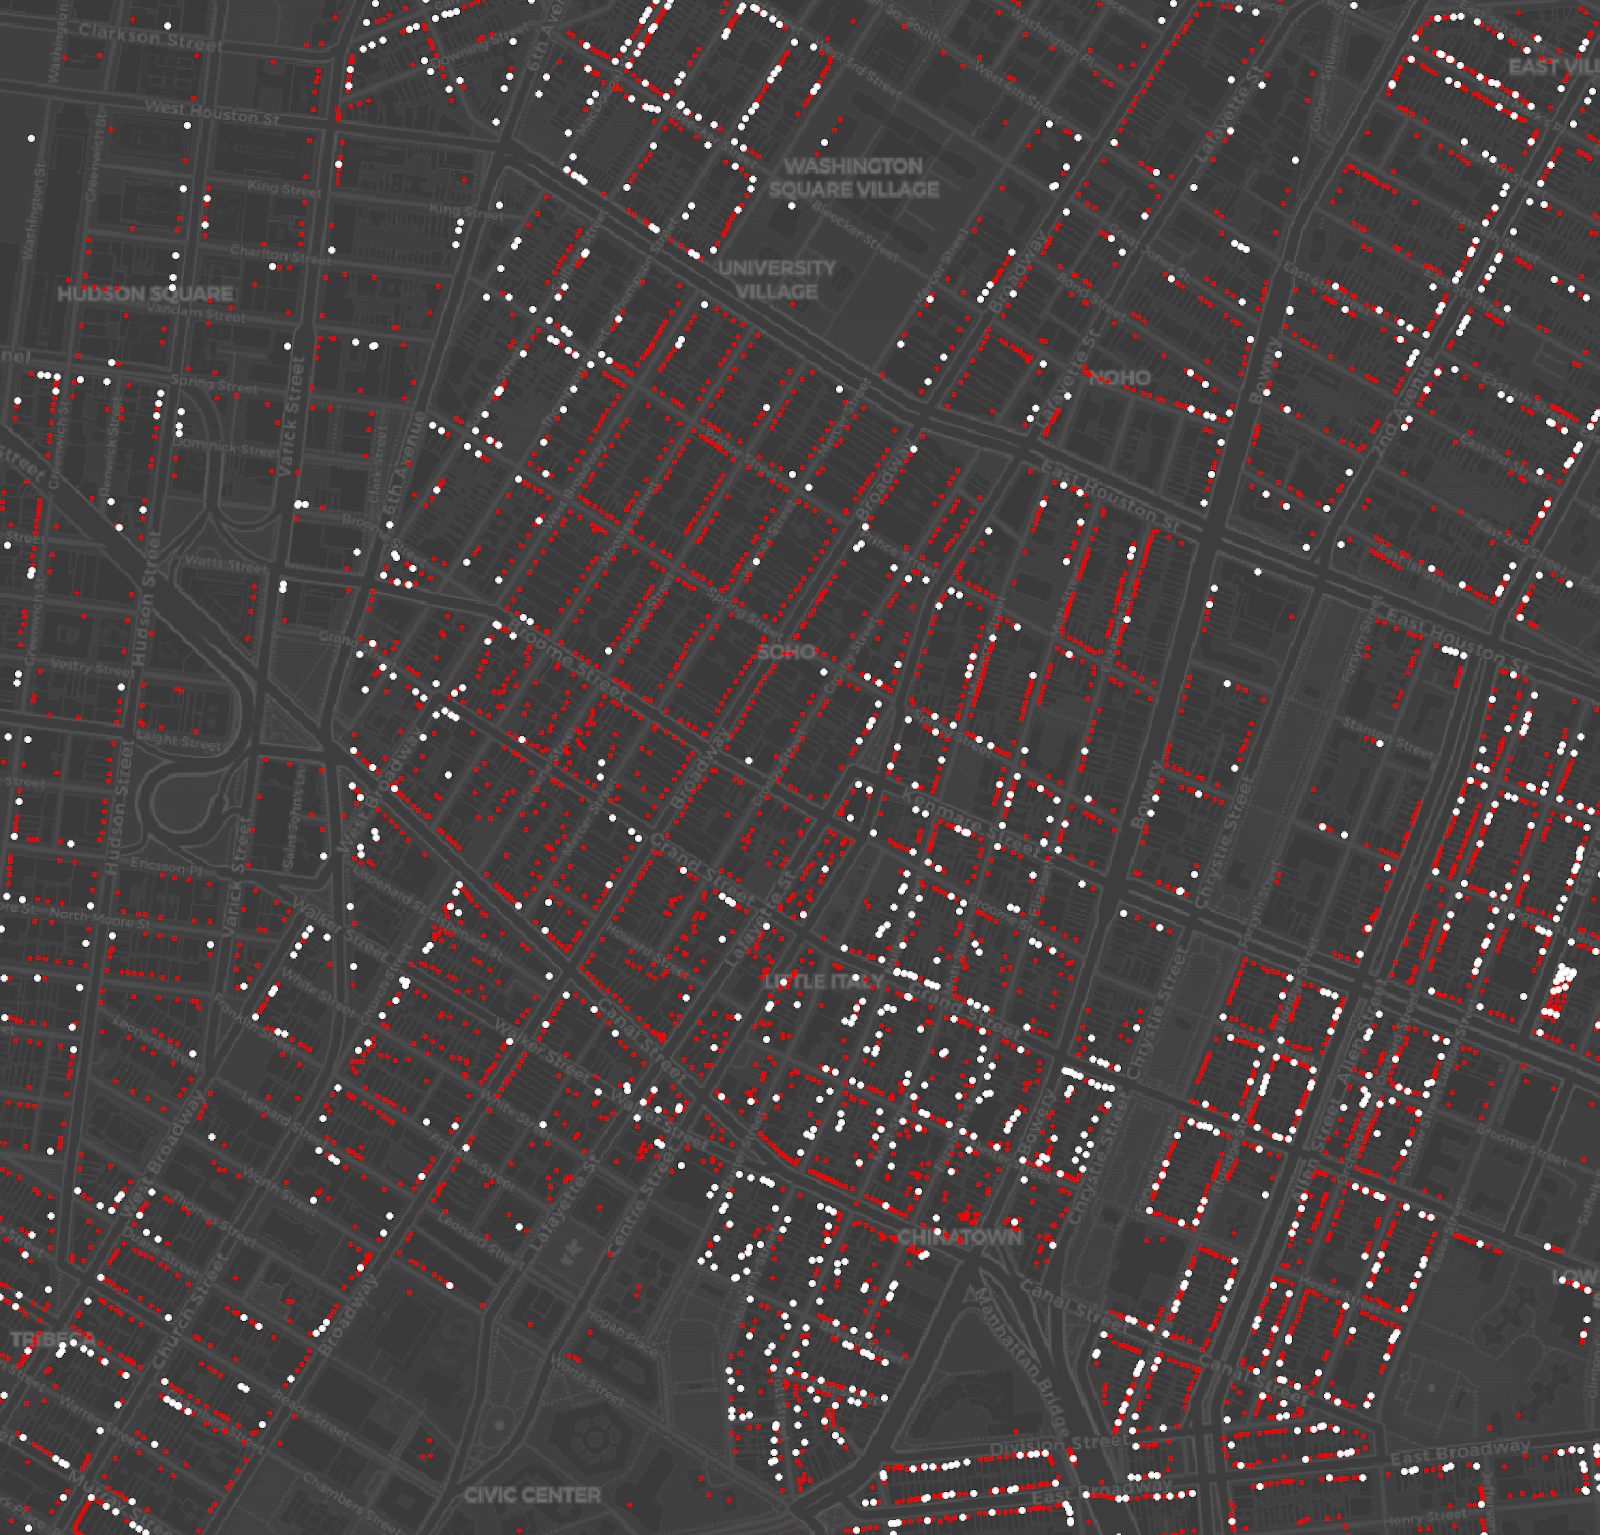
White dots: Stores open during the lockdown. Red dots: All stores open normally before lockdown.
What activities are most affected by covid19 lockdown?
One group of stores that might be most affected are stores with goods in stock that may be damaged or hard to sell after the lockdown period They are generally also small businesses that are not very liquid and cannot survive extended periods of time without revenues.
They are labor intensive –> 5 to 6 workers / 100 m2
Apparel –> Clothing, shoe’s, etc. They currently have stock that will be out of style by the time they can reopen and will probably have to sell at huge discounts to move their existing stock.
Food & beverage -> Bars, restaurants. Even though Manhattan has a lot of restaurants that are staying open to run delivery service during the lockdown, their revenues are significantly reduced and they are assumed to be closed during the lockdown for purposes of calculating the Retail Occupancy Index. On the other hand, in our hypothetical doomsday scenario after the lockdown (described later) we’ve assumed only 50% of them reopen.
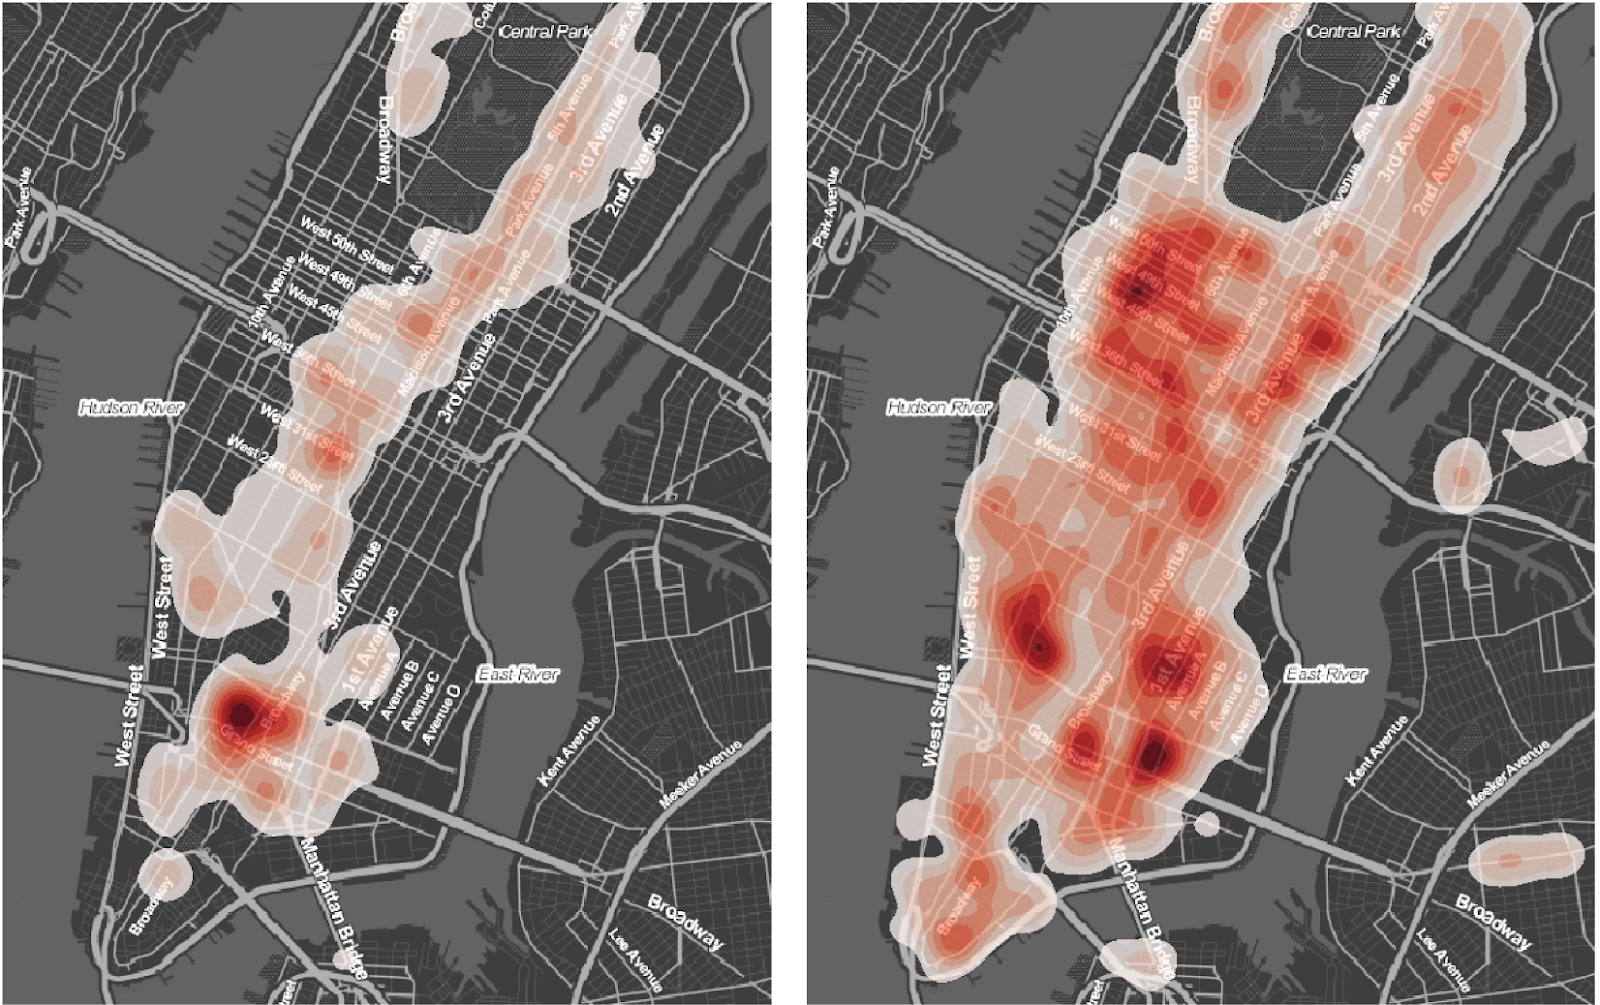
Another group of stores that are significantly affected during the lockdown are those that depend on tourism, especially those in the most touristy areas of the city.
White dots: Stores open during the lockdown. Red dots: All stores open normally before lockdown.
DEFINITION OF POST-COVID19-LOCKDOWN SCENARIOS
Pre-lockdown scenario
Based on the store-by-store inventory Eixos conducted in the summer of 2019 of every retail space in Manhattan, we know that the average retail occupancy in Manhattan was 90.46% (ROI = 90.46). See our report for more detail on the retail scenario as of the summer of 2019.
Covid19 Scenario
During the lockdown, only the essential activities are open:
food, groceries and pharmacies. retail occupancy is below 30% (ROI 26.60)
Medium impact scenario (m) (post-lockdown)
All activities reopen after the lockown except apparel stores.
Average retail occupancy in Manhattan is slightly over 80% (ROI 81.91) in this scenario.
DoomsDay scenario (dd) (post-lockdown)
After the lockdown all activities are open except apparel stores, and 50 percent of bars and restaurants.
Average retail occupancy in Manhattan is slightly below 70% (ROI 69.91) in this scenario.
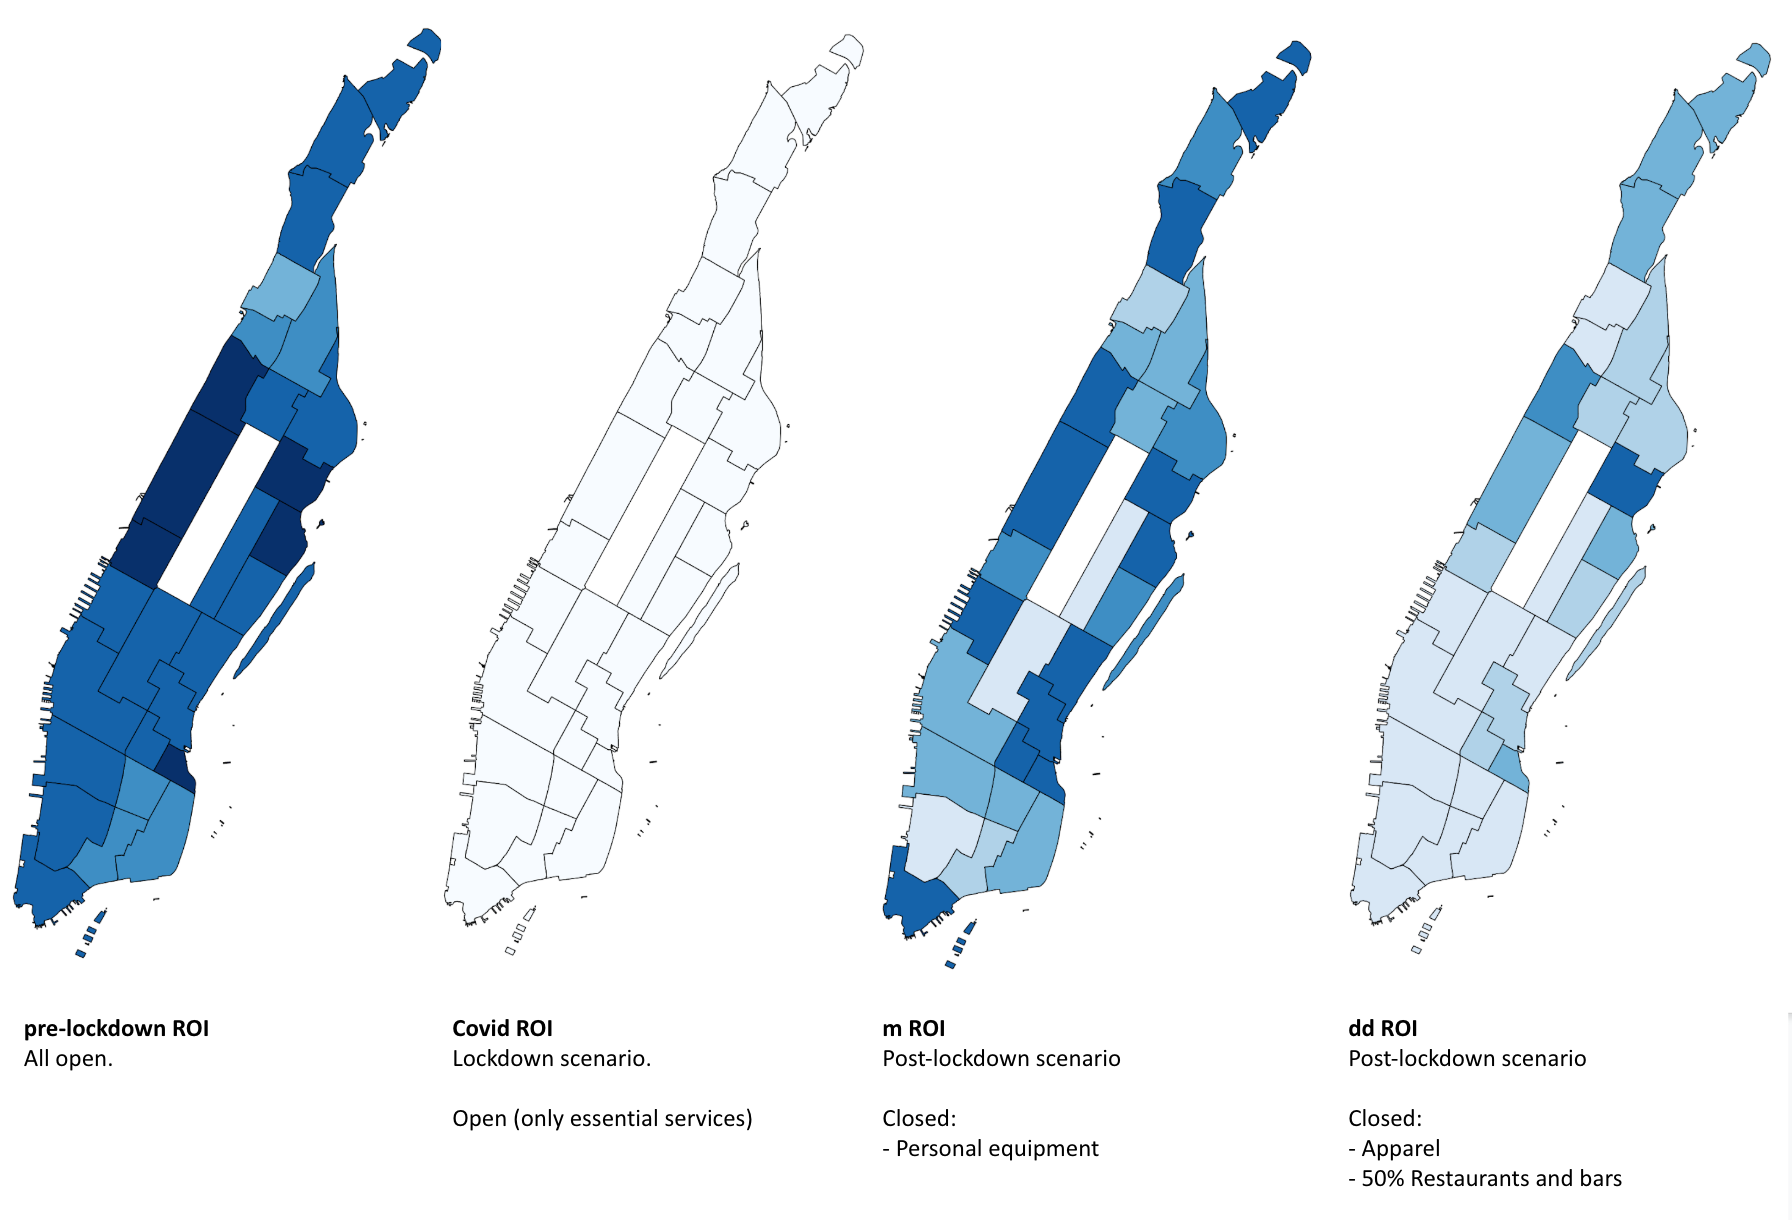
Manhattan retail occupancy scenario. The intensity of the blue indicates the occupancy level of retail spaces.
How many stores may close before it turns really ugly?
In order to keep retail occupancy at a healthy level, the ROI should be 80 or higher. However, it is especially important to at least be above an ROI of 70, which is considered the critical point for severe desertification.

Retail closures depending on occupancy thresholds.
Retail occupancy variation derived from covid19 lockdown effects.
In order to detect the neighborhoods most affected by the massive closure of stores, and the difficulties in re-opening, we have established a “minimum leap” index that represents the variation between the current scenario and the medium impact scenario (m), where all activities are open except apparel stores.

Post quarantine Retail Occupancy Index variation.

Post-covid19-quarantine hypothetical scenarios number of closures.
Conclusions. From minimum impact to Post-covid19 Doomsday scenario.
We defined two post-lockdown scenarios..
One of moderate damage, moderately optimistic:
In this scenario, apparel stores (clothes, shoes, jewelry, etc.) remain closed; other activities are also affected, but less so. This is not a great scenario, as it involves the closure of between 10% and 30% of the economic activities on the groundfloor of the city. It destroys a retail model based on independent shop owners, which we define as entrepreneurs who own between one and four retail establishments.
The most damaging scenario, the Doomsday Scenario, is also plausible:
In this scenario, persistent closure seriously affects both apparel stores, as well as the restaurant and hotel industry. Given the importance of tourism in Manhattan, and the fact that tourism will not return to the pre-Covid-19 crisis levels for up to a year, this is a very realistic scenario.
But this scenario is bad not only for tourism. The norms of social distancing, which affect the social life that fills bars, restaurants and nightclubs, are here to stay. These norms can be unilaterally applied by the government at any time they see they fit, be it for health reasons or other reasons, and this possibility has to be considered.
This scenario involves 30% to 50% of the active premises remaining closed, depending on the neighborhood.

Post lockdown scenario retail stores at risk.
Can disaster be avoided? What to do?
Understanding that a catastrophic scenario is one that causes irreversible changes to a previous scenario, and taking into account the data we present, we find that such a scenario is very possible. Everything indicates that there will be big changes, some of which will be irreversible.
Ensuring that the medium-impact scenario (m) or better is the ultimate outcome will largely depend on how the various agents, who have the power to transform the commercial landscape, end up acting. These agents are primarily public administrations at various levels of government and decision-making, and they are key to the outcome. If these public administrations drag their feet and act late, the worst-case scenario outlined in this article, or worse, is very possible.
The doomsday or worst-case scenario could lead to the collapse of the heretofore very successful “Mediterranean city model”, as it exists in Manhattan. High levels of vacancy for extended periods of time could lead to a gradual migration of retail to a more “high-street” or “main street” model of retail, where retail is concentrated on main commercial streets (likely the avenues and primary cross streets of Manhattan). It can also lead to islands of retail desertification.
Long-term vacancy would also mean losing a lot of independent businesses that, until now, were solvent and met fundamental needs in our cities. Moreover, it will take time for future businesses to replace the shops that close during and shortly after this emergency, and any long-term vacancy problems will discourage some potential new shops from opening.
Therefore, it is necessary to take decisive action, necessarily led by the public administrations, to ensure the minimum damage to the retail sector of the borough. Among other things, businesses need support to keep their workers on the payroll, to pay their rent and loans, to move more of their business online, and to make other adjustments to their business model. This will require accessing the resources in the federal CARES bill, as well as additional resources and assistance from the State, City, and philanthropic sector. Any and all things that can be done to support businesses in accessing these resources will be critical. The city agencies, business improvement districts, and local non-profits should all coordinate to the maximum degree possible to facilitate this access.
Retail makes a city.
Co-authors:


#Business


Next article


Hippocrates, the father of medicine, wrote about the connection between health and location in about 400 BC. Taking a geographic view of health has always helped in developing more effective solutions to mitigate health issues. Common problems cannot be solved without intervention and intervention is impossible without visualization offered by ‘Maps’. GIS-based mapping helps in identifying patterns and get insights which lead to unmatched solutions that have the capacity to solve health crises quickly.
COVID-19 pandemic is an exceptional health crisis that has taken the world by storm. The entire world is staggering under its influence and while every country is trying to find a way to control the spread, maps can play a vital role in controlling the harm.
Technology companies worldwide are innovating every day and coming up with solutions to fight the coronavirus. For instance, recently, Google released COVID-19 Community Mobility Reports to help authorities understand the impact of movement restrictions imposed to control the spread of the Coronavirus pandemic.
Italy is one of the worst affected countries of the world with 183,957 confirmed cases as on April 22, 2020 as shown by the Coronavirus Live Update. In this hour of health emergency, it is not surprising for the largest Italian energy company, Enel X to collaborate with world’s #1 location platform, HERE Technologies and create a map-based solution to combat the spread of COVID-19.
To aid the Italian governmental agencies fight COVID-19, Enel X and HERE Technologies have launched the ‘City Analytics – Mobility Map’, a big-data solution which is equipped to provide Italian governmental agencies with mobility indicators to analyze the impact of COVID-19 containment measures.
The solution will enable the authorities to gain a better understanding of the impacts of the COVID-19 containment measures, identify areas that need more support in the implementation of these measures and analyze the gradual return to normalcy, once the pandemic is over.
Using anonymized and aggregated location data from connected vehicles’ sensors, navigation systems, mobile applications and governmental agencies, the City Analytics – Mobility Map will estimate variations in public movements and kilometers travelled throughout the national, regional and municipal areas. It will largely aid in finding out developments in mobility flows across the territory and consequently plan the recovery phase.
According to Edzard Overbeek, CEO, HERE Technologies, “HERE Technologies is determined to leverage its location intelligence in the fight against the global coronavirus pandemic. Together with Enel X, we hope to help the country contain and control the spread of the coronavirus while protecting the privacy of Italians.”
The data-analysis will significantly aid in fighting COVID-19 and bringing in normalcy post pandemic by indicating the daily percentage change in the number of trips in an area and the total kilometers traveled, as compared to a weighted average from January 2020. It will provide aggregated regional, provincial and municipal views.
The City Analytics solution will also indicate the proportion of incoming and outcoming daily and weekly trips according to the origin or the destination per region, province and municipality.
“The new release of City Analytics is an innovative tool developed to meet the needs of government agencies taking on the emergency. Thanks to the collaboration with HERE Technologies we have provided the country with an effective solution for evaluating developments in mobility flows across the territory, which can be used to plan the recovery phase” said Francesco Venturini, Head of Enel X.
What makes the solution from Enel X and HERE Technologies more useful in this time of crisis is that it is providing the data-analysis free of cost. Governmental bodies and the Civil Protection Department can access the data on the Enel X YoUrban portal for free until May 31st, 2020. The solution can be accessed at https://www.enelx.com/it/it/smart-city/soluzioni/soluzioni-smart/dashboard-covid-19.
The data is also available to the public. If anyone is interested in knowing about the mobility flows throughout the national, regional and municipal areas, he can know it through the dashboard on the Enel X website and support the Italian government during this challenging period.