
If you’re a tech geek or you simply read news from time to time you’ve probably already heard about Bitcoins. Launched 5 years ago Bitcoin has, in the last year, moved from the domain of crypto-geeks to a more mainstream adoption and it’s market value is constantly rising. At the video below created less than a year ago, the value of the virtual currency is less than $20… today it’s already over $1000!
If you happened to one of early adopters of the concept (which probably mean you’ve been doing some stuff ‘in the dark web’), you’ve easily made quite a lot of money. The problem is that it can still be quite difficult to find retail shops that accept bitcoin. Until now. This new interactive map solves that issue by showing brick and mortar locations around the globe where customers can pay in Bitcoins or Litecoins.
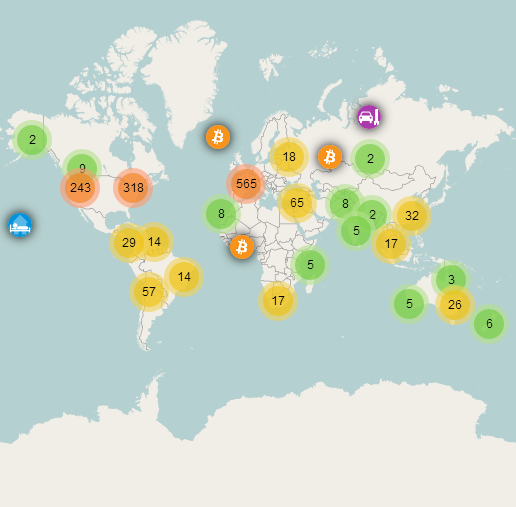
In early November this map was only showing around 500 venues. 4 days ago 1400. Today there are over 1,700 locations added. Since there is such a big interest in the project I guess that a cartographer could contribute to the project as we all could point out some significant improvements that should be made to the map… like for example… adding a legend…
If you happened to not know the Bitcoin currency, here is a short explanation what is it all about.

#Ideas


Next article

Nerve of EU Countries (Part – 1)
…. Why don’t you ask the kids at Tiananmen Square; @Hypnotize. An awesome song by “System of a Down”. It’s about the Tiananmen Square Massacre of 1989.THE “protest”, started with student demonstrations afterward hunger strikes, military action, death toll and ended with remembrance. Protest, the action of expressing objection and these objections might tell us about the political dissent which can be caused be leadership change, policy change, crisis or when it’s become a question of human right.
Politics; it’s exciting and a very mature word. Of course it’s just not a word rather the answer to several conflict questions, specially where peace is questioned. Under such political process, protest is a form of action expressing objection to something. Understanding the pattern of protest we can settle tomorrow’s peace today. Protest pattern study can be a clue to unlock the question to several political process as well.
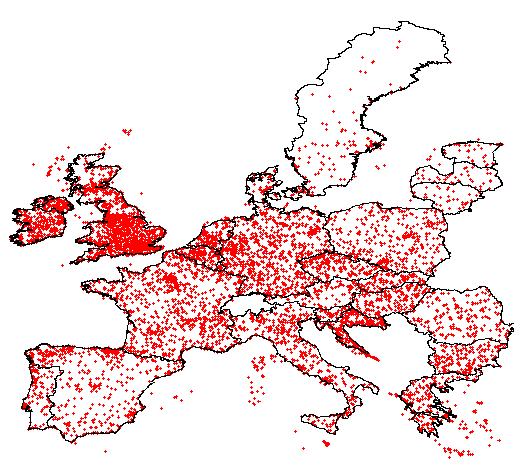
Here the following plot shows the distribution of protests all over the EU countries and the density as well. accordant to the density statistics 547.531 square units and per square unit and the mean density is about 140 per unit area. this plots were created based on Global Data on Events, Location and Tone (GDELT) data sets.
-
- Protest distribution in Eu Countries (1979 – 2012)
-
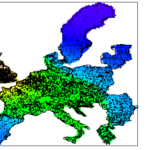
- Protest density in Eu Countries (1979 – 2012)
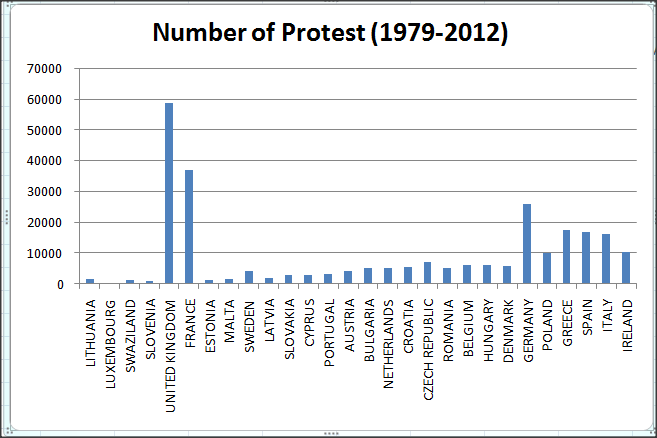
Here’s the another GDELT protest time series for the all EU countries form 1979 – 2012. there are in total 265, 122 protest in those 30 years. there is also another plot showing the total number of protest according to countries.
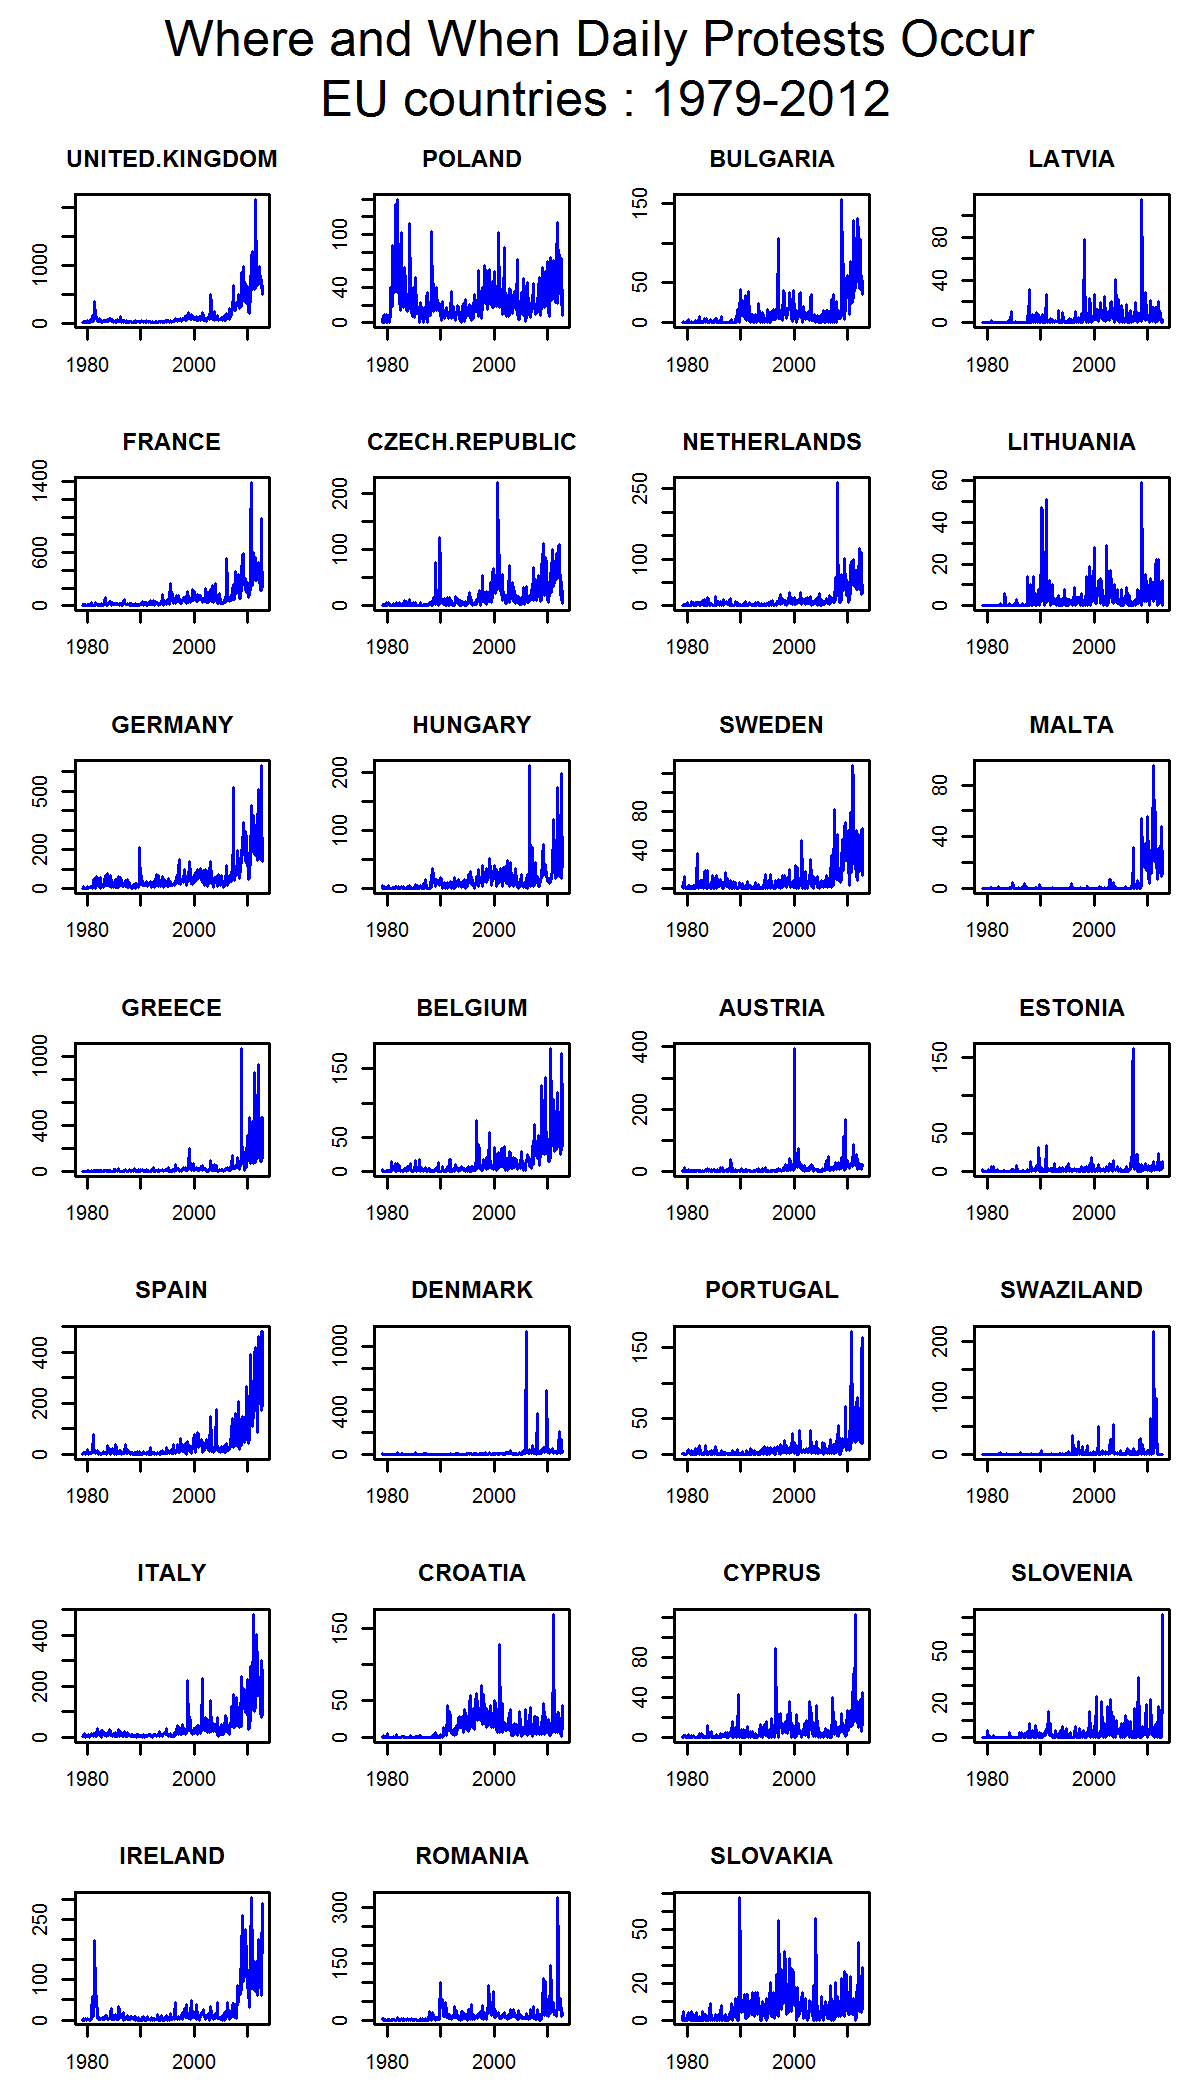 from the country wise plot we can see that the height number of protest were observed in UK, France, Germany. Greece, Spain, Italy and Ireland (though the data is not normalized but still it gives a signal of number of occasions and frequency of activities). besides the time series plot also shows that there is a increased number of protest in most of the countries after 2005 and that is because of increasing data availability. but in most of the countries we can observe a change after 2009 (increased number of protest) and we also can observe a similar kind of patter after 2008 in Greece, Ireland, Portugal, Spain, Cyprus, Italy and so. I assume it’s because of the “Euro Crisis”. Besides euro crisis at the same time there was also 2008, Irish banking crisis, Automotive industry crisis of 2008 etc. Most interestingly i have found that there are always highest number of protest in Poland, though I have no clue why is that. do you have any clue about that?
then I though about going a little bit detail after the year 2006 (… as the data availability has been increased by then). and here you can see another time series plot for the period 2006 – 2012. in those plots we can see several peaks in particular time. so I started googling to find some answers to those peak. here’s what I have found in the internet:
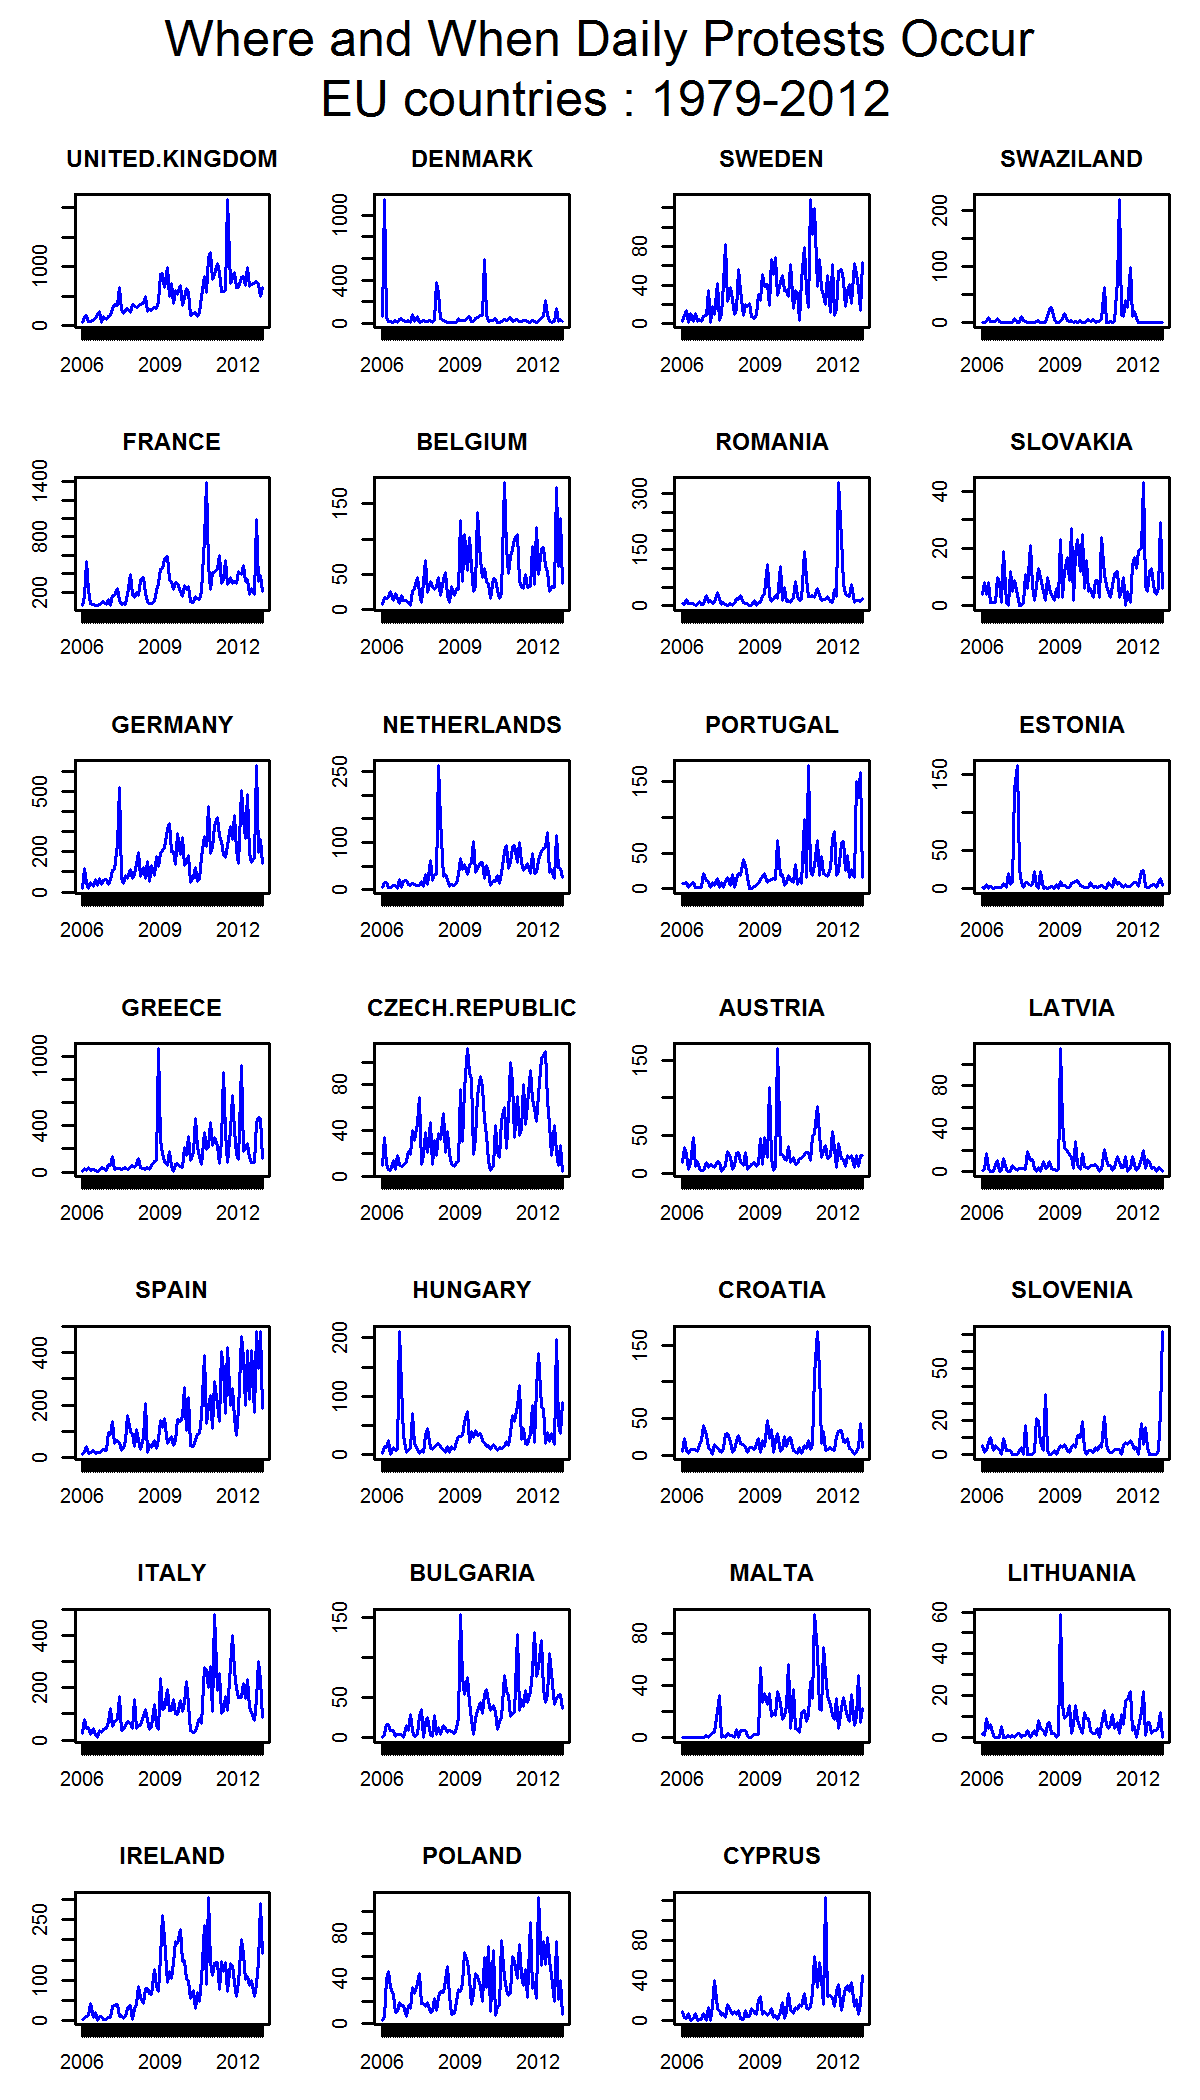
Denmark and Netherlands (march, 2008) : Shouting angry slogans against Denmark and Netherlands for insulting Islam
France (October, 2010): hit by new wave of mass pension protests
Romania (January, 2012): a series of protests and civil manifestations triggered by the introduction of new health reform legislation (reduced state funded health benefits)
Estonia (march, 2007): Protests against the removal of the Soviet Bronze Soldier statue have turned into clashes between protesters and police, as well as Estonian nationalists.
Greece (December, 2008): The 2008 Greek riots started on 6 December 2008, when a 15-year-old student, was killed by two policemen
Austria (October, 2009): student protests in Austria against restrictions on the access to higher education
Croatia (April , 2011): failure of political promise, Economic slump and institutionalized corruption
Slovenia (December, 2012): protests against the Slovenian political elite members; accused by corruption
Bulgaria (January, 2009): anti-government protest turns into riot Started with economic crisis and became violent as protesters clash with police (January, 2009)
summing up, if we put our finger on EU nerve we find it weaker than before. there are unrest. unrest because govt. failed to keep the promises, Police had lost control accidentally and triggered the human right activist, euro crisis pushing the crisis tolerance boundary, policy change or authority change can cause harm to the stability.
By the way, if you liked reading it, keep an eye on Geoawesomeness. Soon, I will appear with some more findings.