
![]()
CartoDB is one of our favourite mapping companies. Together with Mapbox, CartoDB revolutionized the way that we do interactive online maps. It gave maps back to the people and democratized online cartography. Yesterday the company announced a new product followed with a quiet rebrand.
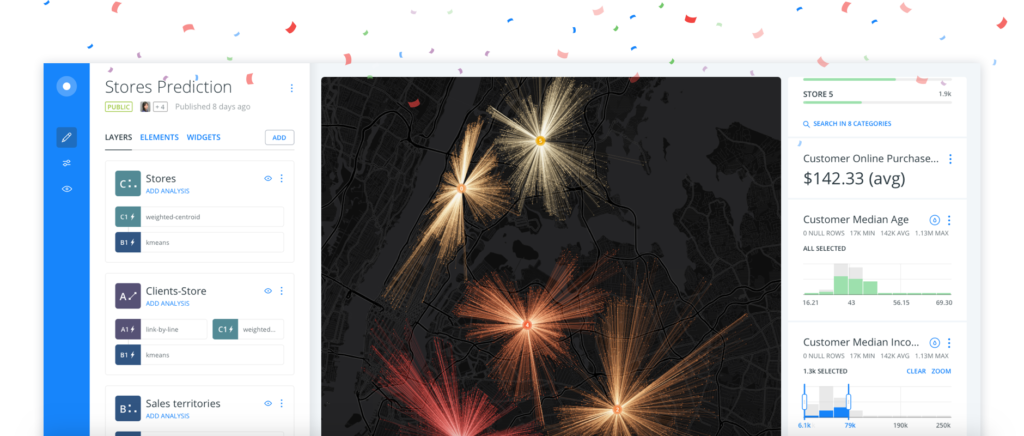
The new CARTO Builder is an online drag and drop, WYSIWYG platform that allows you to easily build map-based dashboards for location data analysis. It’s simple, awesome and it doesn’t require any coding which was a problem for many ‘nondev’ users that could not utilize the full capabilities of the service. The aim of the new platform as well as the vision of the company is to make mapping easier and more accessible to everyone not only to developers.
From the brand perspective the CartoDB suggested maps “Carto” and databases “DB” that subconsciously brings coding connotations. Removing the “DB” makes it feel more user-friendly even if you can’t write a line of code. Carto has opened an early access program for Carto Builder on July 7 but the product will live alongside the existing CartoDB Editor for a few months, with the aim to be eventually phased out. I guess that this is why the rebrand is rather quiet.
Great job Guys! We love the new logo!

#Business


Next article
Recently we wrote about an interesting project that mapped light pollution around the world. The map has been generated based on satellite images of nighttime lights around the world. The problem with that approach is that it’s based on data from above not observations on the ground. In other words it’s a great way to get a global picture but it won’t provide you with enough data resolution to measure the light pollution in your neighbourhood.
Researchers from Nottingham Trent University developed a technology that might solve this problem. They’ve created a light weight, low-cost sensor system that allows to measure the light pollution. The device was designed to be mounted to a drone but it can be also used as a standalone tool. The new monitoring system is based on a microcontroller and standard servo motors, and the data it gathers is stored on an SD card. Ashley Fuller a researcher working on the project commented for Geoawesomeness:
The sensor that is being used to measure the light pollution is a Sky Quality Monitor or SQM for short. There are two different types of SQM there is the standard SQM and the SQM-L. The standard SQM has a cone of view for the light sensor of 84 degrees. The SQM-L has a cone of view of 20 degrees, this is good for taking reading at various angles from the zenith. The SQM-L comes with different port types such as the SQM-LE which has a Ethernet port and the SQM-LU which has a USB port. It is quite a simple device consisting of TSL237 light sensor and a microcontroller. The light sensor converts the frequency of light into a current then this signal gets processed by the micro controller and converted into a number that can be displayed in various ways. The sky brightness is given in the units of Mag arsec^-2.
Although it’s still to be tested in the field the team see it being used by for example national park rangers carrying out their work on site. Interestingly it’s yet another project that looks into drones as a platform for carrying sensors. Nice project!
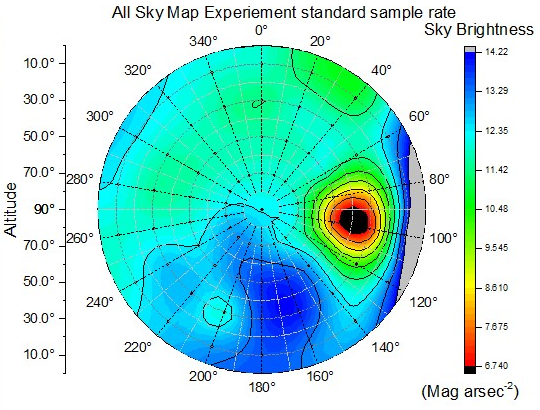
A sky map taken using the data collected from a calibration light source. The visualisation shows the distribution of light in one hemisphere and represents what is essentially a fish-eye view of the entire sky. Image credit: Ashley Fuller/Nottingham Trent University.