
The ‘orange peel problem’ is perhaps the most widely-cited analogy that geographers use to explain why a three-dimensional world cannot be represented in two dimensions sans any kind of distortion. Try as you might, you just cannot flatten an orange peel without tearing, squashing or stretching it. Likewise, when cartographers try to flatten the Earth for a map projection, distortions in terms of shape, distance, direction, or land area are inevitable to creep in.
Depending on the purpose they are trying to serve, the number of possible map projections is limitless. However, which map projection should be used for general purposes, such as, for hanging in classrooms or on TV news? Here’s how some popular projections weigh against each other:
Mercator map projection
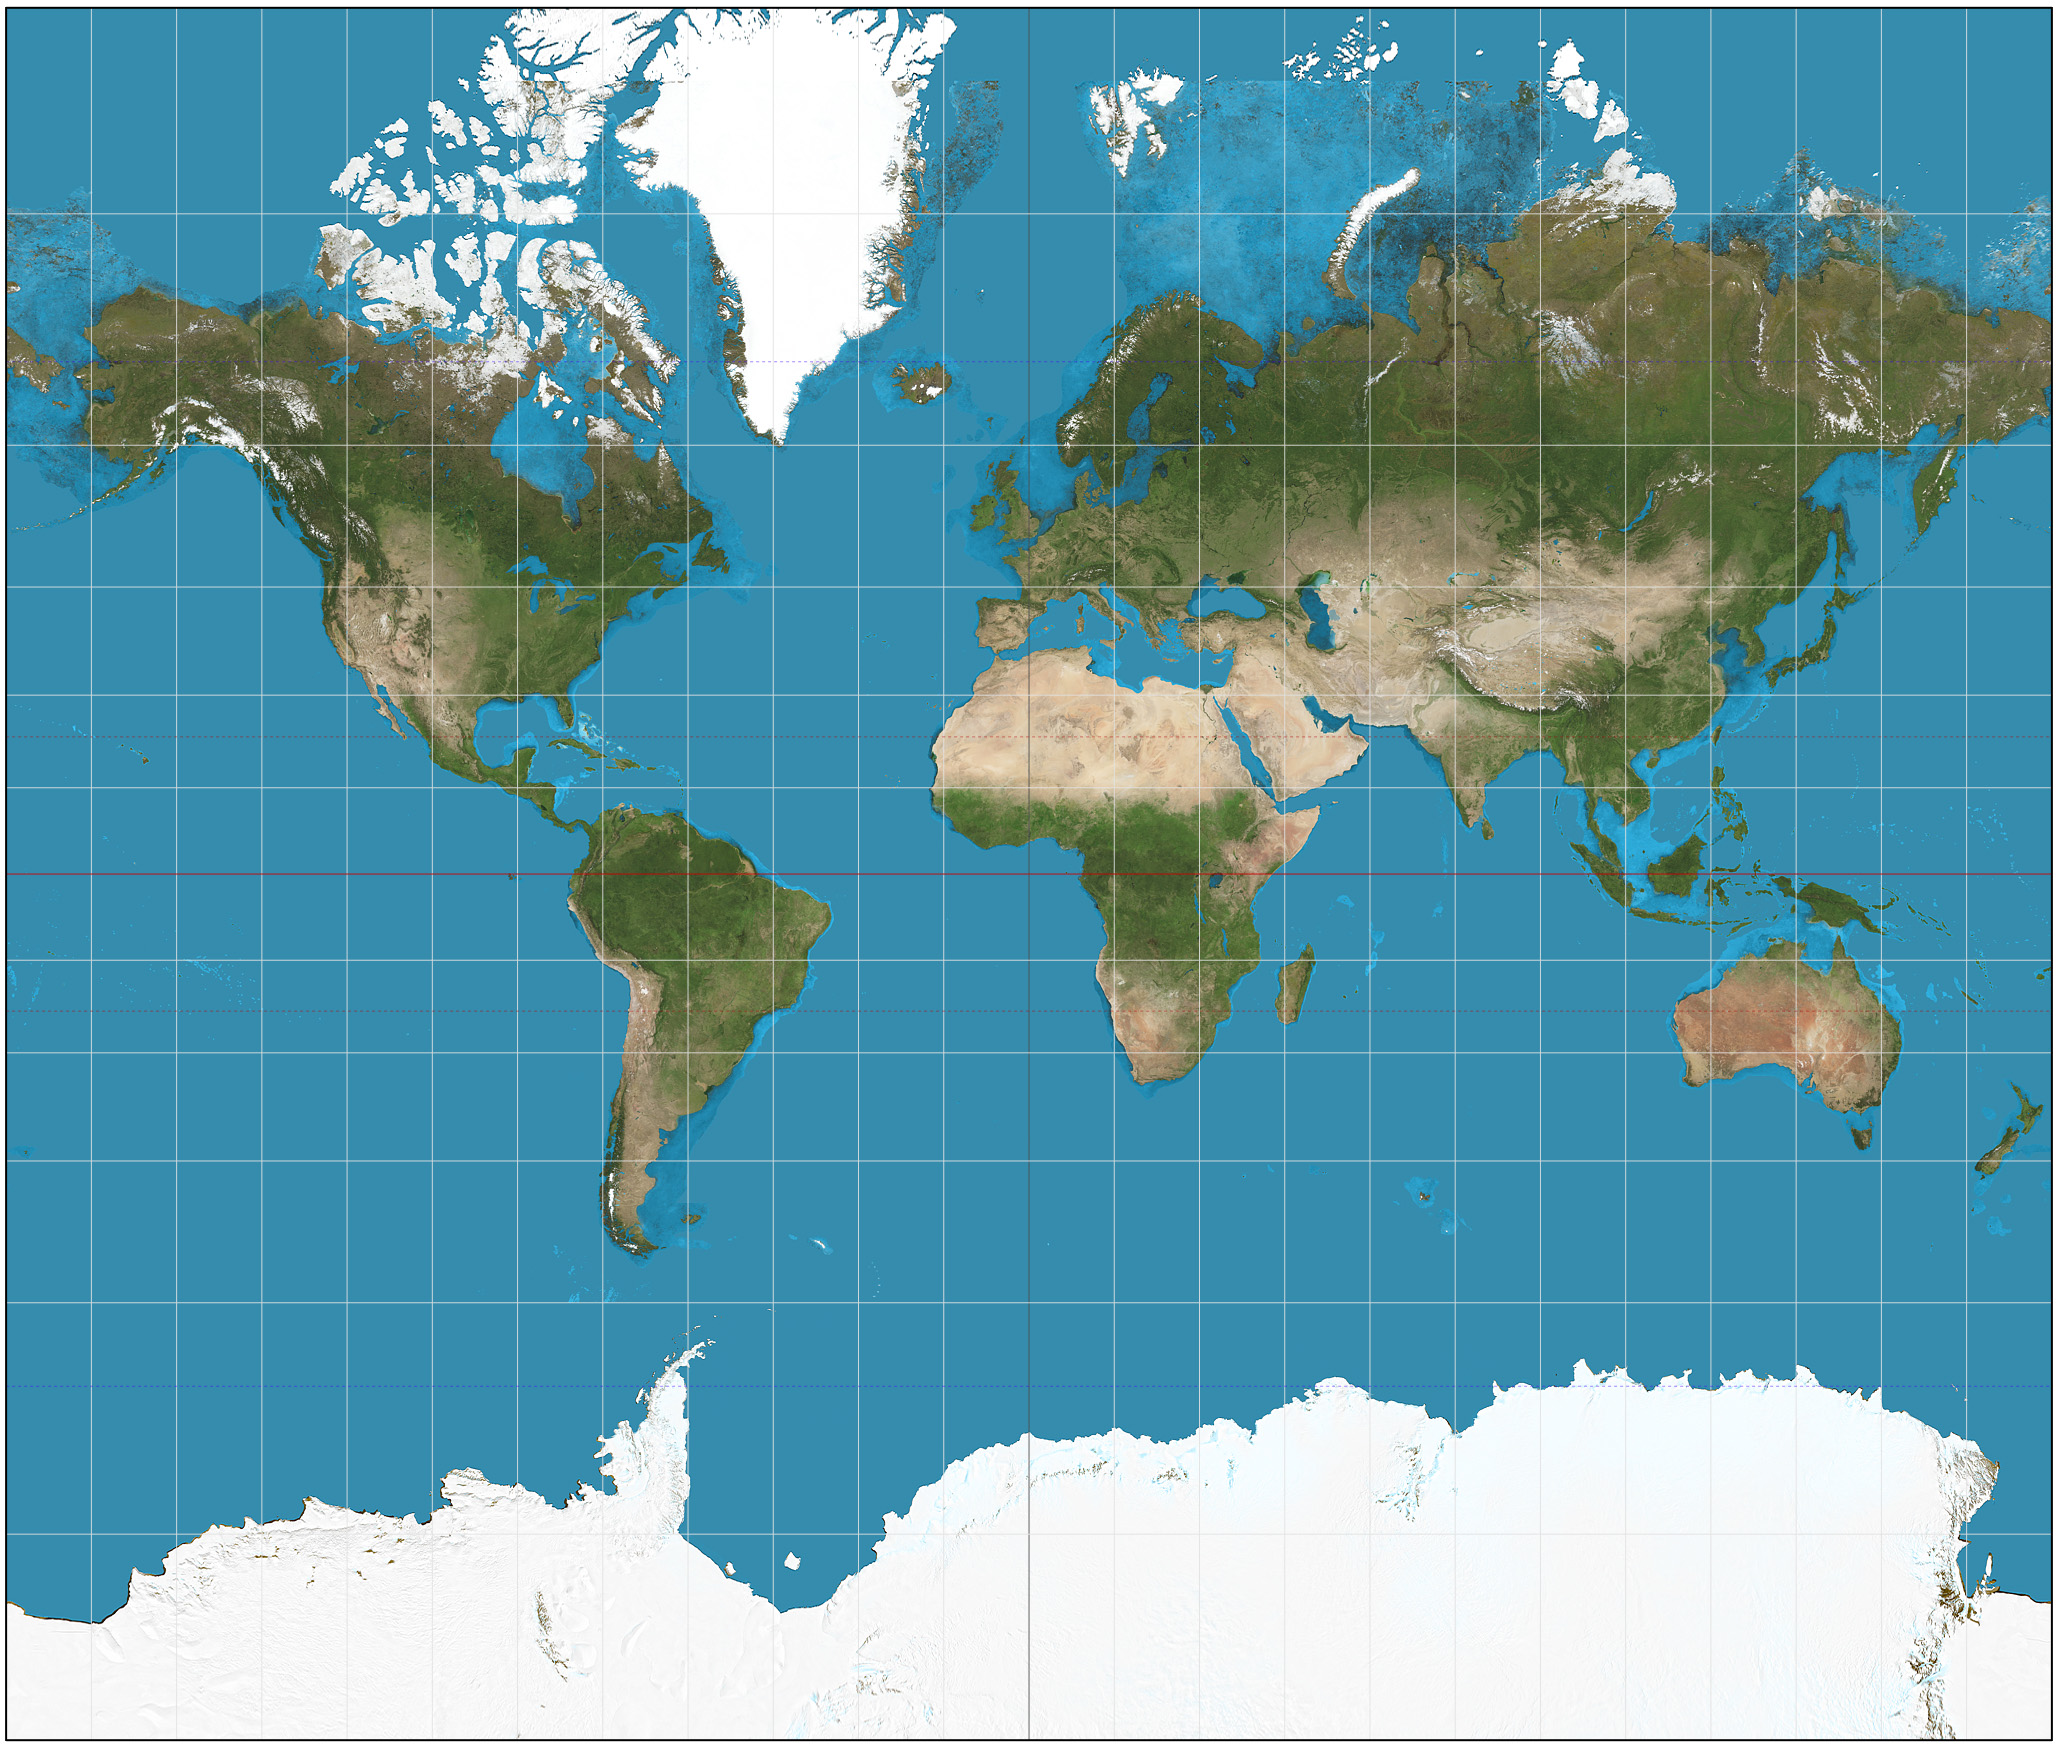
The most popular map projection in the world has been around for 448 years now. It was created by Flemish cartographer Gerardus Mercator in 1569 – a time when Antarctica hadn’t even been discovered. Mercator was designed as a navigational tool for sailors as it was most convenient to hand-plot courses with parallel rules and triangles on this map.
In most maps, when you try to fix one kind of distortion, you increase another kind of distortion. However, Mercator is one of those rare maps whose answer to latitudinal distortion was to ensure that the longitudinal distortion is equally bad!
On a Mercator projection, Greenland is roughly the same size as Africa. In reality, Africa is almost 14 times larger, and Greenland can fit inside China no less than four times. The map also suggests that Scandinavian countries are larger than India, whereas, India is actually three times the size. And yet, Google Maps, Bing, Yahoo and even OpenStreetMaps continue using some version or the other of the Mercator to display the world.
Pros: Sailors loved it; preserves angles and directions in a small area
Cons: Bad for understanding the real size and shape of continents and countries
Related: After this video you’ll never trust a map again
Gall-Peters
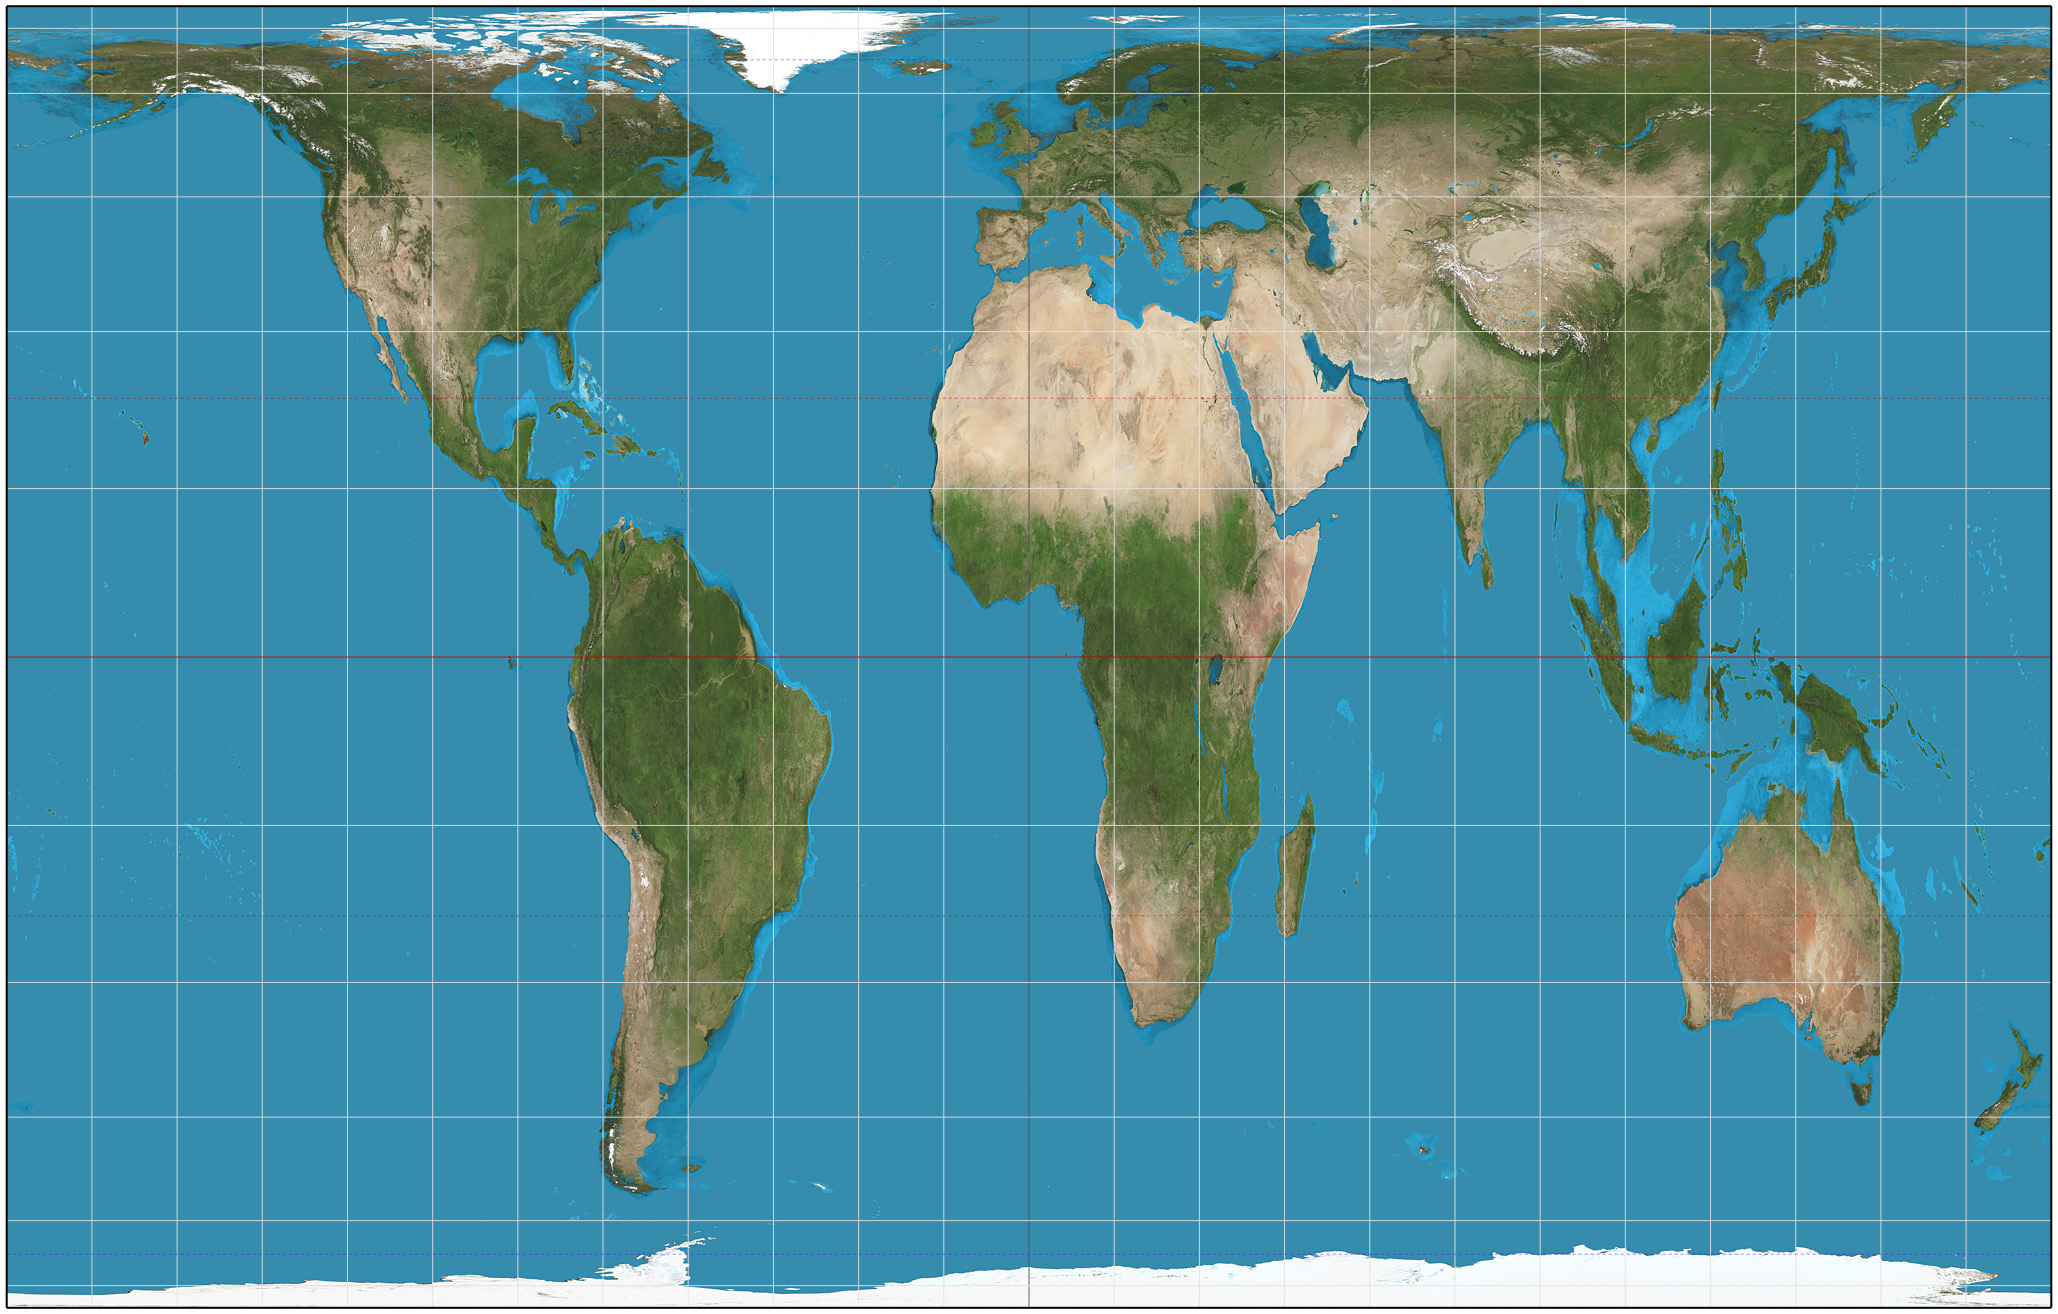
The biggest criticism for the skewed Mercator projection came in 1973 from German filmmaker and journalist Arno Peters. Peters argued that by enlarging Europe and North America, Mercator maps were giving white nations a sense of supremacy over non-white nations.
His solution? An equal-area projection that would show the correct sizes of countries relative to each other. Not that the Gall-Peters projection came without any flaws. In its quest of removing size distortions, the map stretched some places near the poles horizontally to a shocking degree. It also stretched land masses vertically near the Equator. So, if the map looks really odd to you, it’s because the shapes and angles are all wrong – exactly the reason why we don’t see this map online much. Nevertheless, it’s quite widely used in the British school system.
Pros: The only ‘area-correct’ map of its time; got featured in The West Wing (S2E16)
Cons: Galled the cartographic community in the 1980s
Suggested: Do you know how maps of Game of Thrones were created?
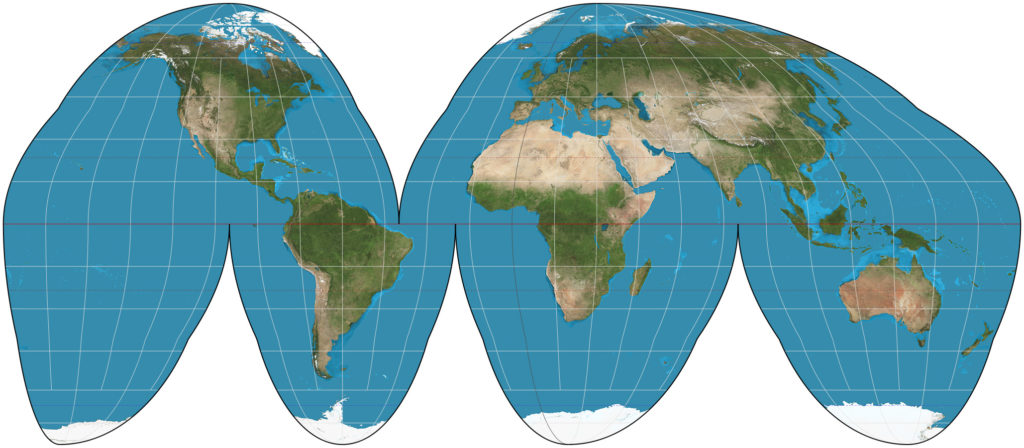
Robinson
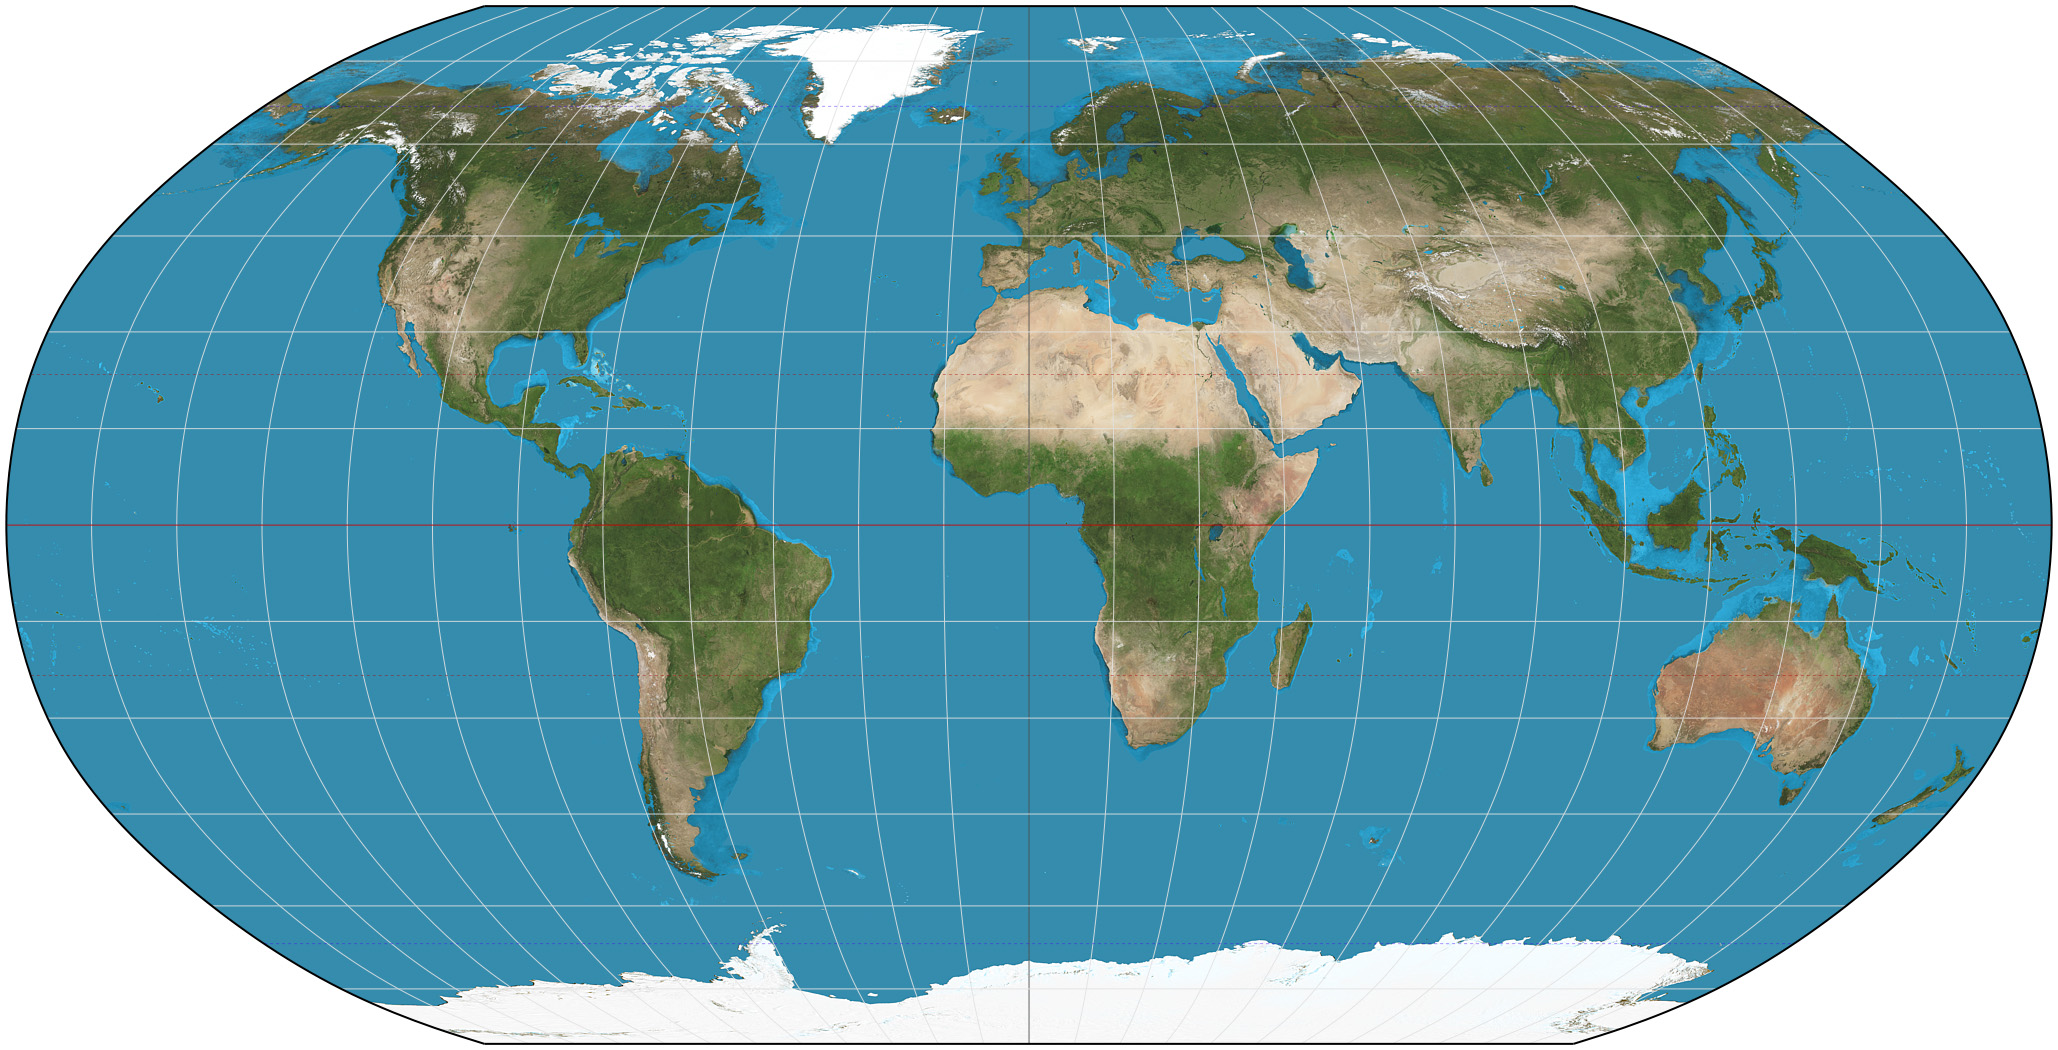
American geographer and cartographer Arthur H. Robinson came up with this projection in 1963, focusing more on the ‘look’ of the map than precise measurement of places. Robinson intended the map, which is neither equal-area nor conformal, as a general purpose tool.
In fact, he told the New York Times in a 1988 interview, “I decided to go about it backwards. I started with a kind of artistic approach. I visualized the best-looking shapes and sizes. I worked with the variables until it got to the point where, if I changed one of them, it didn’t get any better. Then I figured out the mathematical formula to produce that effect. Most mapmakers start with the mathematics.”
Hopefully, this map would replace Mercator in classrooms.
Pros: Shows the entire world at once
Cons: Compromises both area and angles, especially at the poles
Interesting: Which map did Christopher Columbus use?
Winkel-Tripel
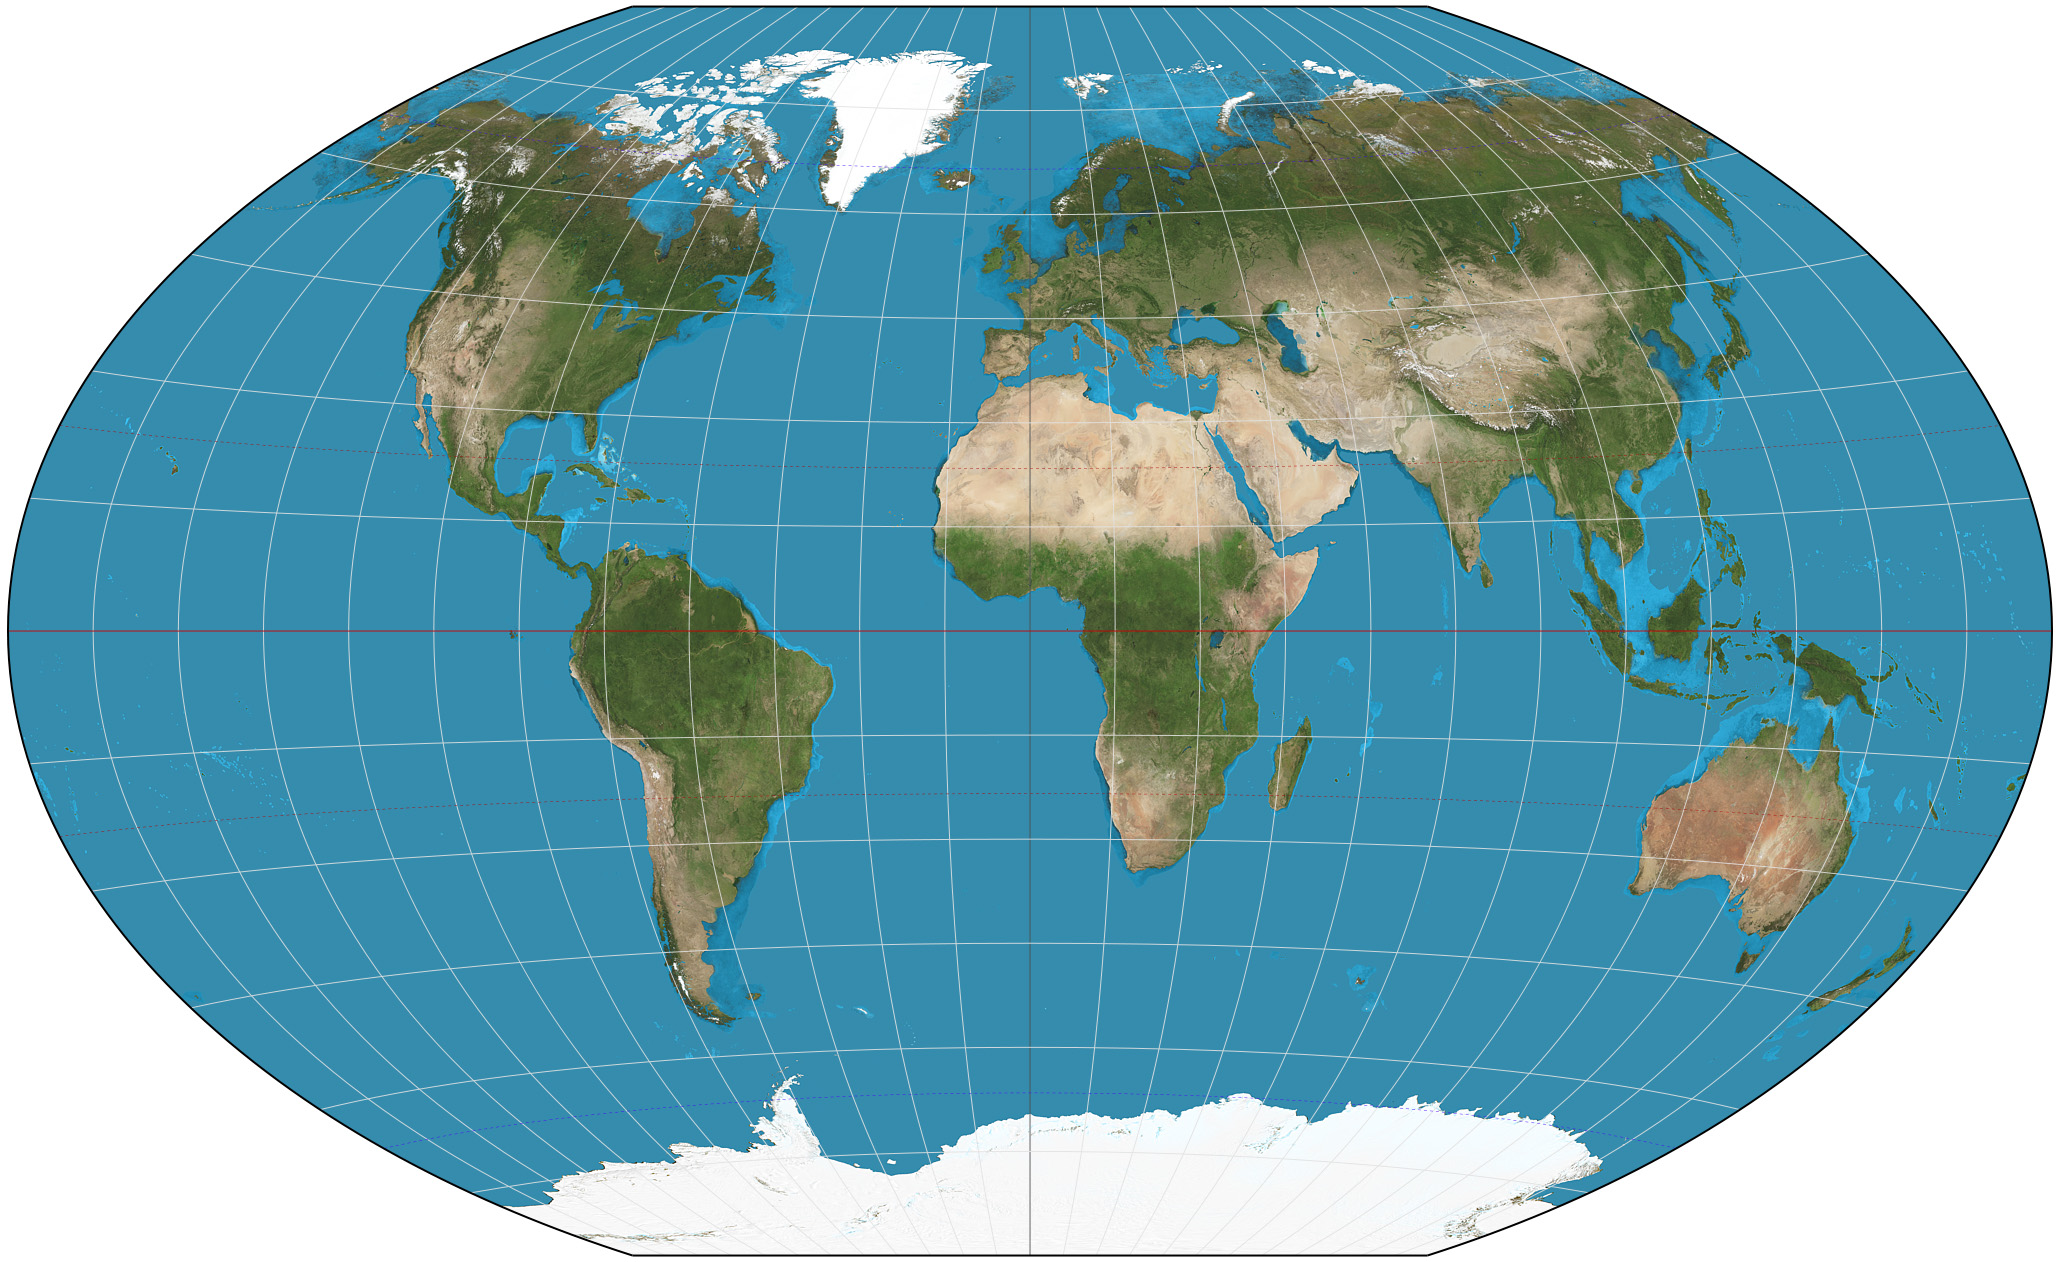
Proposed by German cartographer Oswald Winkel in 1921, the Winkel-Tripel projection is quite the opposite of Robinson. The map resorts to mathematics to curtail three major types of distortion – area, direction, and distance (and hence the German term for ‘triple’, Tripel, is in the name). This map projection shows Greenland as the same size as Argentina, and not as the size of all of South America.
The National Geographic Society has been drawing all its standard maps using the Winkel-Tripel projection since 1998, and many US schools have followed suit. However, despite its popularity, since the map doesn’t preserve angles, it is nowhere close to replacing Mercator for navigation purposes.
Pros: Reasonably accurate shapes and sizes of countries
Cons: Land masses closer to the poles still enlarged
Must see: These 5 tools will let you master map projections
AuthaGraph – the best map projection?
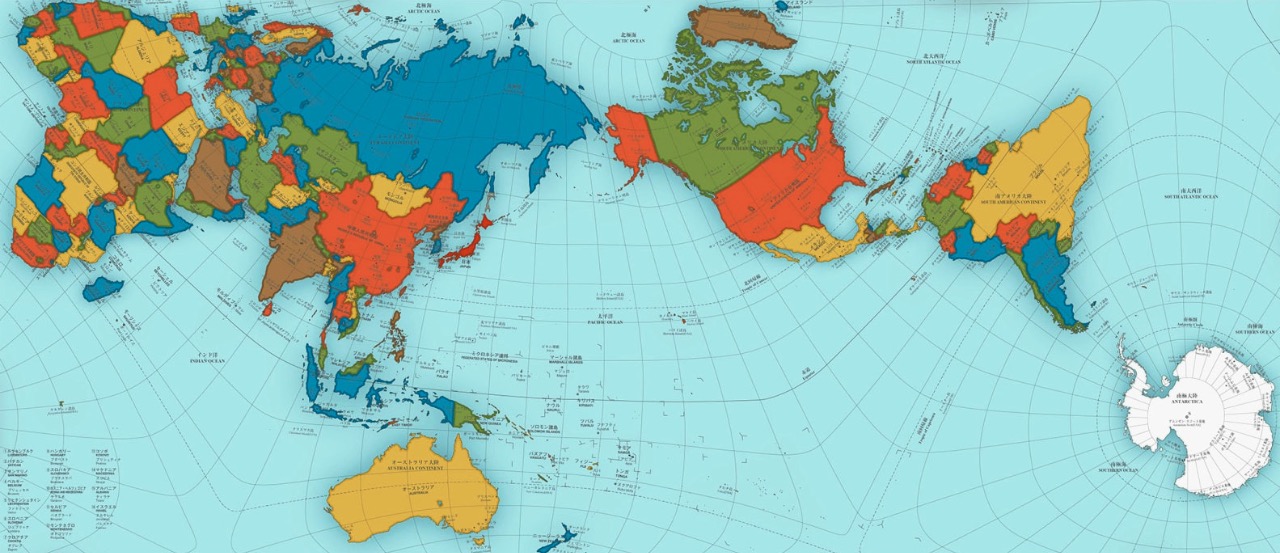
This is hands-down the most accurate map projection in existence. In fact, AuthaGraph World Map is so proportionally perfect, it magically folds it into a three-dimensional globe.
Japanese architect Hajime Narukawa invented this projection in 1999 by equally dividing a spherical surface into 96 triangles. These triangles were then projected onto a tetrahedron, which not only helped maintain the proportions of land and water, but also helped to unfold the map into a perfect, flat rectangle. Narukawa, however, insists that if the map is refined a step further to increase the number of subdivisions, its accuracy will improve and it can officially be called an area-equal map.
Nonetheless, AuthaGraph realistically represents all oceans and continents, including the neglected Antarctica. And while the general shape of the continents is maintained, you will notice that their orientation is skewing upwards – as if in a smile!
Pros: Most accurate; will win you Japan’s biggest design award; can be folded into a 3D globe
Cons: The Arctic Circle gets somewhat squashed
Is your favorite map projection not on the list? Let us know in the comments below!

#Ideas


Next article

Open source is thriving and in fact proving to be a great success even in enterprise markets. Boundless, one of the most recognised names in Open GIS announced earlier last week that it has been awarded a $36 million contract by the National Geospatial-Intelligence Agency (press release).
The National Geospatial-Intelligence Agency (NGA) is the lead agency tasked with Geospatial Intelligence in United States Of America and act as the primary source of GEOINT for the U.S. Department of Defense and the U.S. Intelligence Community.
The contract with Boundless supports NGA’s GEOINT services and purchase services required for development and maintenance of open source geospatial software packages. Its quite likely that the award is mainly targeted towards Boundless’ latest offering Boundless Desktop – a full-featured, desktop Open GIS solution targeted at enterprise customers.
Here’s what Andy Dearing, CEO of Boundless told Geoawesomeness about the deal
“Here at Boundless, we want organizations to realize the power that open source geospatial technology can give them. NGA has fully embraced the benefits of open source, through initiatives like Pathfinder and GEOINT Services. NGA is not alone – many other organizations are showing interest in understanding the flexibility and scalability benefits that the supported Boundless technology platform brings to their business. We are excited to be a part of this movement!”
In 2012, Red Hat became the first Open source company to reach over $1 billion in annual revenue. The Open Geo companies might be still far away from scaling that mountain but it definitely augurs well for the GIS industry as a whole that this goal is not impossible.
Read more: The Next Generation of GIS according Andy Dearing, CEO of Boundless