
The goal of cartographer is to create a spatio-temporal model of a certain phenomena and communicate it to the public in the most effective way. For years artists (at that time all cartographers were artists) used canvas and paper to show dynamic phenomena on a static media. Computers have changed it and allow to create amazing, interactive and very functional maps. But space in a not a flat surface and human senses, and therefore cartographical communication process, works most efficiently in multi-dimensional environment, namely real-life, tangible objects. This is why I always look with interest at projects which go beyond the digital or mobile user experience…

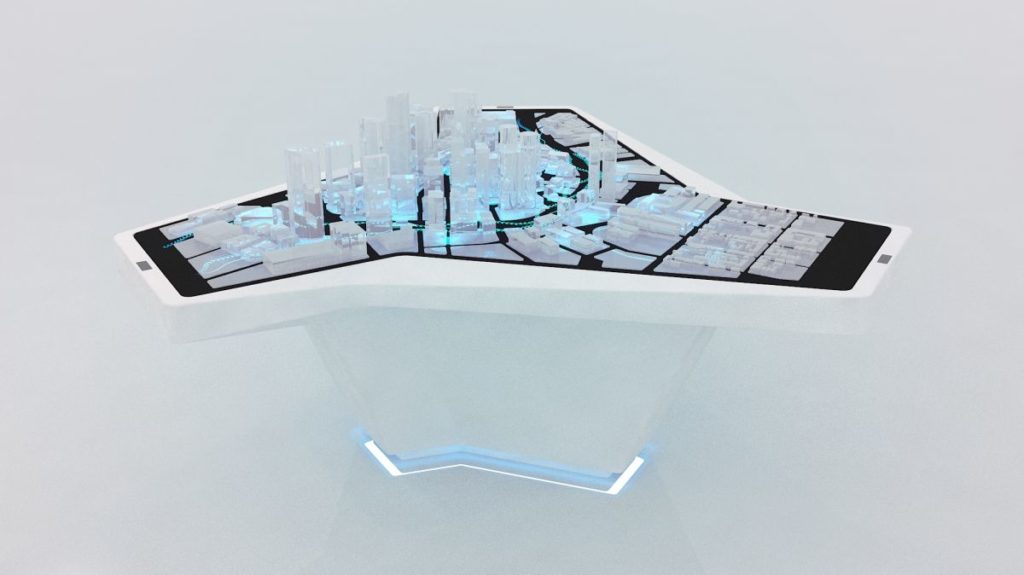
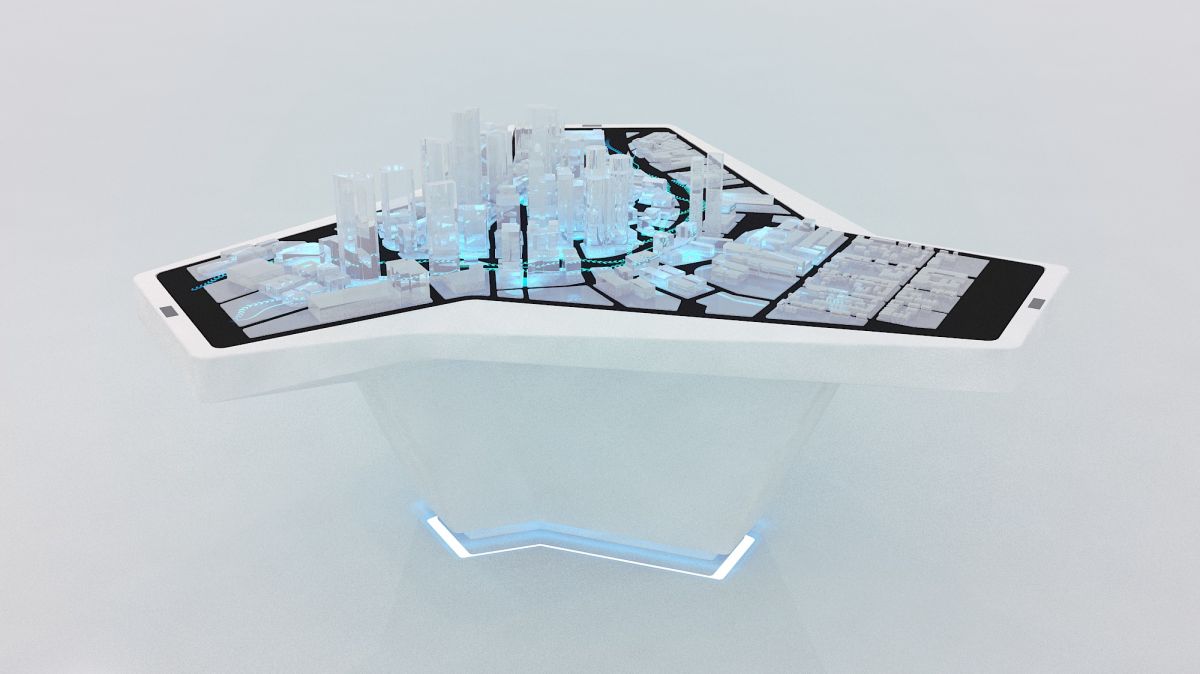
At the Consumer Electronics Show (CES) 2014 in Las Vegas, Audi promoted its Urban Future Initiative with this amazing interactive, augmented reality table to represent Boston’s urban mobility. The table has three arms made from acrylic grass covering flat screen monitors. Road traffic is shown in digital form on the glass surface. Visitors can interactively influence the city traffic by making swiping movements with their hands developed with Leap Motion controller. By gesture control visitors input data that optimise the flow of traffic into the system.
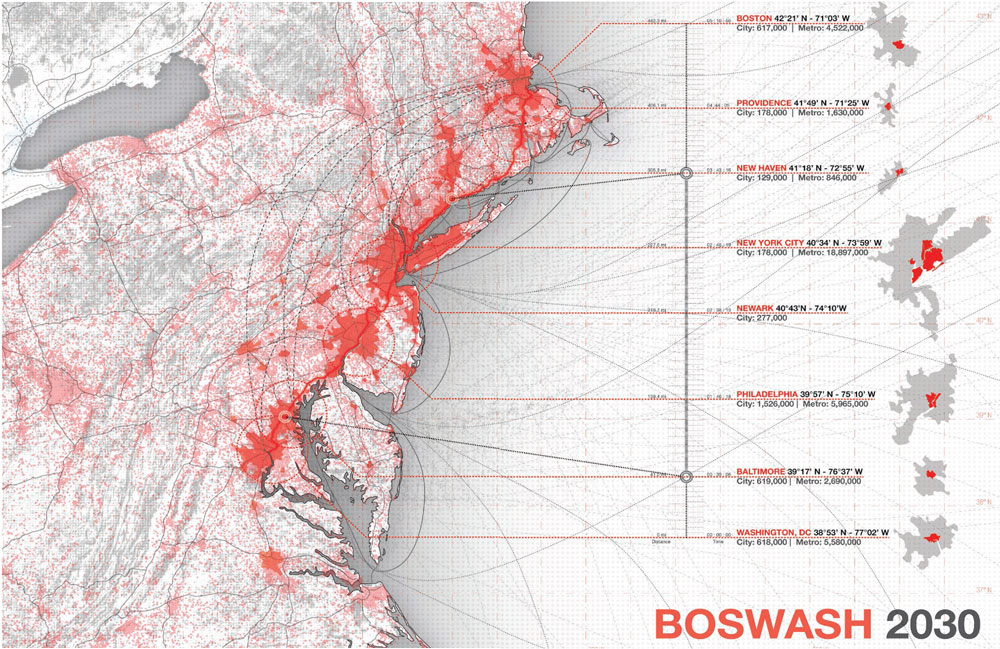
The data for the project come form the project called City Dossier Boston, which was developed by architects and urban planning company Höweler + Yoon, the winner of the Audi Urban Future Award 2012. Höweler + Yoon analyzed bottlenecks in the Boswash transportation network and derived visionary solutions. The task of presenting the output of the project has been given to the agency for communication design “Madhat” which did a pretty amazing job.
source: Audi

#Ideas


Next article


How many times have we tried to create cool videos of our over complicated data on Google Earth and gave up not being able to get what we want? I am not sure about you all, it has happened to me more than I would like !
Remote Geosystems Inc has come up with a solution by introducing Line Vision Google Earth. Mainly focusing on industry, the Line Vision software helps you to overlay your data as 3D tracks with Google Earth as a base map.
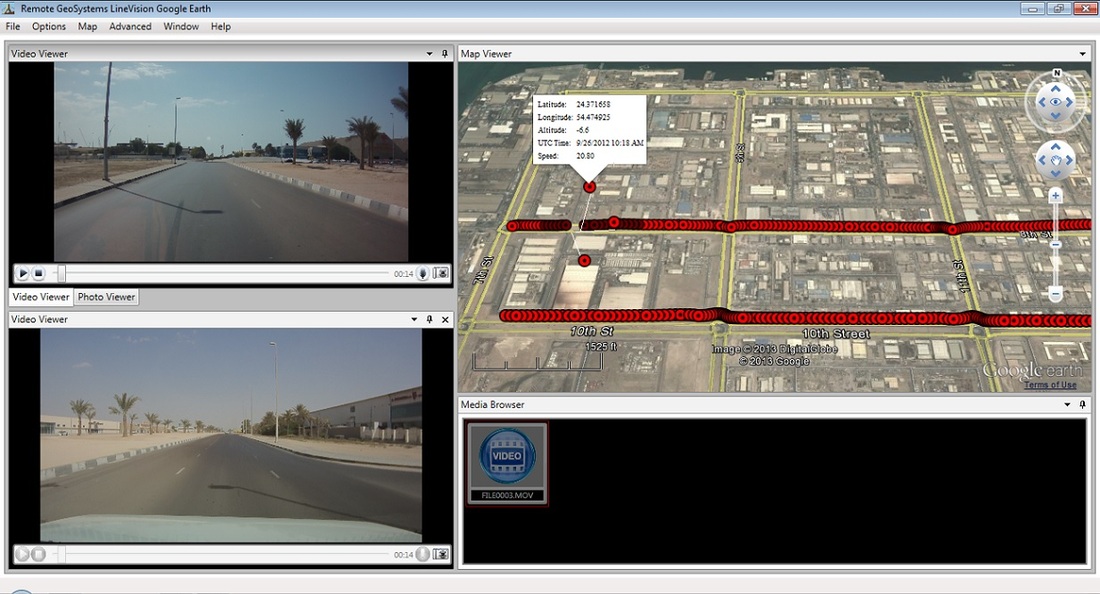
LineVision Google Earth enables users to geospatially “navigate” a video recording by simply clicking a location along the aerial or terrestrial GPS track positioned in Google Earth. The video then automatically advances to that point in the video so that analysts and subject matter experts can visually interpret what was recorded at that specific place and time. As the video plays, a “cursor” moves along the GPS track, constantly indicating where the current view was recorded. If something of interest is detected in the video, users may also “snap” a still image from the video, which is geotagged and saved for future analysis.
How cool? Well, is there a catch? Most certainly!
Priced at 995 USD, it might not look attractive for normal users. But companies and industries looking to detect gas leakage by creating single or multiple (dual, triple and quad) geospatial video streaming, this is the place to be!