
How do my users move in this city? Where do they go? What does the “flow” of this city look like? How does that change throughout the day?
These are the questions that we hear from our users (mostly micro-mobility companies or on-demand companies) quite often. If you are a micro-mobility company (ride-sharing, ride-hailing, carpooling) and these questions inhabit your mind as well, the article should help you navigate through some of those questions.
What is movement analysis?
However, in order to understand the metrics between two events over a trip, movement analysis is very useful. Movement analysis is primarily done on ping data that is either received from vehicle sensors or from driver apps and helps you in understanding how your users and assets move on the ground.
Characteristics of movement (or trips)

Trips in a city
- Origin: Where do the trips originate from? For example, in the morning, as users travel to their place of work, trips are likely to start in residential areas or near bus stations or metro stations for the last-mile.
- Destination: Where do the trips end? Similarly, in the evenings, users mostly travel back to their homes.
-
Paths: What are the most common routes or paths taken by the user? What paths do the most valuable users take? If there are multiple ways to reach a destination, which paths do users take? For example, if you are a carpooling or ride-sharing company, this should also help you analyze what are the most frequented routes for you to pick up the maximum number of users.
-
Distance: What is the average distance of the trips and how does that change with time? Where do long-distance trips originate from? Where do short-distance end to? For example, a lot of trips to the beach are long-distance and are on weekends. Moreover, they originate from the center of the city.
-
Time Taken: What is the average time taken during the trip and how does that change with where the trips originate from? Do short-distance trips also take a lot of time to travel because of the routes they travel through?
-
Repeatability: How much percent of trips are repeat trips? How many users are repeat users?
-
Characteristic: Trips can have several characteristics of their own. For example: How much revenue do you obtain from the trip? Are they profitable? What are the most unsafe routes for users?
Insights from Analyzing Movement Data
What are the additional insights that you can get from performing movement analysis?Flow
Flow analysis (or network analysis) is to understand how the city moves at different times of the day or even historically.
For example, with one of the last mile delivery companies, studying the flow showed that the delivery partners started moving towards the center of the city and by evening, they started moving out, because most of them lived on the outskirts. But they needed to come inwards because that’s the region in which they receive the maximum amount of orders.
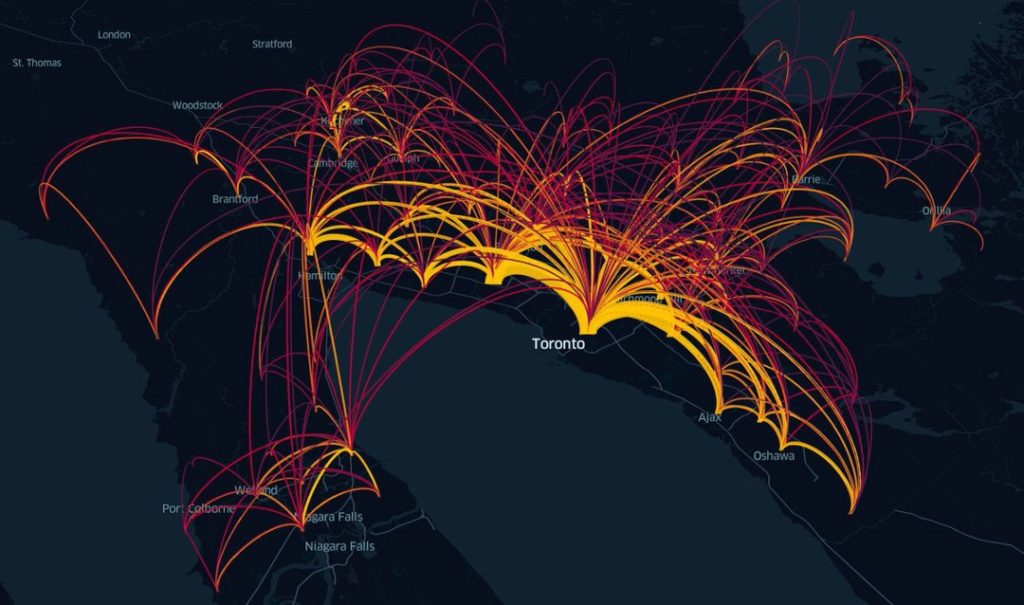
We usually denote the flow using arcs or lines (and play with time to understand its temporal patterns). Arcs layers help us understand the most frequented origin and destination in the city as well as the distance between them. Arcs don’t show you the paths taken between both the points. The image below shows the historical analysis of the flow in the city of Austin.
If companies know how people move, they can make their bikes always available in those locations where people originate from. They can also be used to create personas to target them effectively.
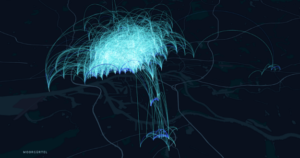
3d arcs
Another way to show the overall flow can also be done using lines that are just a visual representation of the arcs.

2d representation of arcs
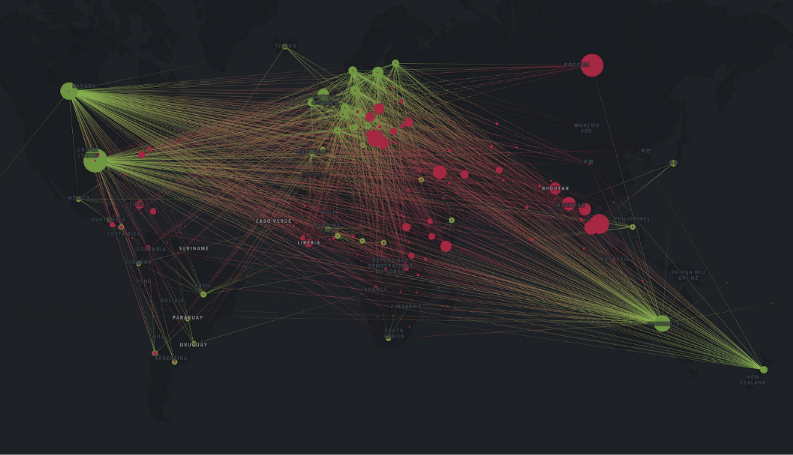
Top O-D Pairs
Just extrapolating from the previous point, when you study the flow, you can also identify what are the top origin-destination points. Knowing the top origin-destination pairs makes reallocation an easy play. You can always keep your vehicles (or drivers) available at those points. This should also help ride-sharing companies to incentivize pick up at those points.
Idle Spots
What are the spots where vehicles or riders are idle while in trip? This is a very important analysis to carry out for micro-mobility companies. They are losing out on money for every minute their bikes are not utilized. Most of them charge on a per km ridden basis. Some of the point of analysis for idle spots are:
- When: Is there a time pattern to when vehicles are idle in trip? For example, in the afternoon near the hotspot tourist location.
- Characteristic: How many bikes frequent that idle spot together? How many unique trips? How many unique users?
- Duration: For how long is the vehicle idle for? For example, outside a hospital or for three hours until the movie gets over.
- Frequency: How often does the vehicle get idle? Is there a temporal or seasonal pattern to it?
- Distance to Nearest Station: If the bikes are supposed to be in a station, how far is the idle spot to that location?
CohortsWho are the users who do the maximum number of trips? What do your power users have in common? How much time on an average do they spend traveling? How much distance do they travel? Where do they go?
Having deep knowledge about your power users is a must to understand what kind of persona has the maximum utility of your product and for what use case.Outliers
Outliers help you understand anomalies in your movement data. How many people go to the outskirts of the city? For example, in a lot of cases, we have observed that people cross state borders (which is illegal). In that case, a thorough understanding of just one user or trip becomes fairly insightful.
Where did this user go? Why? Does he always take these routes? In these cases, having a detailed view of one particular user or trip is important.
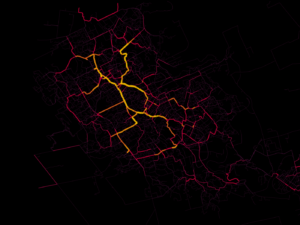
Routes colored by density
Demand-Supply
Demand-Supply analysis is key to optimizing asset utilization (and hence reducing the idle time).
- Next Demand Time: When the trip is ongoing, what does the demand look like at the destination? If the ride is going to end at a location that is actually demand-deficient, your vehicle might end up spending a lot of time idle there or the rider would have to come back without a ride.
- Point of Interest: Another very interesting analysis that can be done is to analyze how the movement gets influenced by different points of interest such as schools, colleges, malls or tourist destinations.
- External Events: It would also be insightful to analyze how different external events such as rain, a large concert, a sports match, protests affect the demand and the supply for your company.


Originally posted here.
Read Similar
- Location Analytics for delivery & mobility companies with ground operations [Link]
- Carto vs Kepler vs Locale: Which product to use for geospatial analytics? [Link]


#Business


Next article

Blockchain has been one of the hottest topics in tech for some time, and like numerous other sectors, the automotive and mobility industry is also exploring potential applications for blockchains. A new patent application published by the US Patent and Trademark Office this month reveals General Motors’ (GM) plans to use blockchain to develop a decentralized, distributed navigation map for vehicles.
The method will leverage one or more sensors embedded in automobiles to evaluate and characterize the surrounding area, including capturing the GPS information and registering the differences noticed on a blockchain map network.
To give you a rough example, if a sensor detects a road change (change in the lanes along a road, a traffic sign, speed limit changes, etc.), it would communicate the same to a perception and localization processor. The processor, in turn, will communicate that information with a blockchain map to detect any discrepancy with regard to the already registered transactions (or map data). Once enough vehicles/sensors relay the same new information to the network, the transaction will be accepted as a valid change and the blockchain map will automatically update to reflect the same.
Vehicles today utilize some type of navigation system that provides detailed maps to either a human driver or to the automated driving system of a self-driving car regarding the geographic location of the vehicle and directions to the desired destination. However, as GM points out, the current mapping systems are difficult to keep dynamic without incurring large costs. As such, there is a need for a new and improved system and method for distributing navigation maps to automobiles.
The blockchain-based navigation map proposed by GM will not only update a distributed navigation map to the vehicle in question, but also to all other vehicles that communicate using the same blockchain map network. More specifically, the system will continuously update the distributed map in a decentralized manner to vehicles that communicate with each other in a distributed vehicle-to-vehicle (or peer-to-peer) network.
Advantages of blockchain-based navigation maps
In essence, GM recognizes that the many benefits of using blockchain technology to develop a decentralized, distributed navigation map for vehicles. These include:
- Decentralizing the updating of navigation maps
- Democratizing map generation from vendors
- Reducing costs for map changes that are validated across many vehicles, and
- Enabling rapid updates of navigation maps