
Drone mapping tech is developing so fast that it’s hard to follow all the industry news. UAVs are getting smarter, faster and overall more complex but there are a couple of trends that are about to move the drone photogrammetry revolution to the next level.
1. Size vs. battery life
The launch of DJI Mavic Pro showed that hardware providers are working on making smaller and lighter devices. Besides the portability, the reason for that is the battery life. The more you save on size and weight, the longer your drone can last on a single charge and today the flight time is the biggest limitation of the technology.
There is a linear relation between the size of the area you can map during a single flight and the battery life. Normally, fixed wing drones can survey up to several square miles and rotary drones below 0.1 mi2 during a single flight. Extending the battery life could enable plenty of new applications or significantly improve currently offered drone mapping services.

2. Advanced Sensors
Most of the drone mapping use cases today are based on a regular RGB visual sensors. The price decrease of advanced sensor technologies now allows using them with UAV platforms. Companies like PrecisionHawk already offers a whole range of mapping sensors including multispectral, hyperspectral and thermal cameras as well as LiDAR.

Such sensors allow applying complex remote sensing algorithms to drone imagery with a millimeter resolution. It brings domains like precision farming to a new level. It allows assessing the condition of crops per plant rather than per acre. It’s a level of detail that was not available ever before, and it will require some time for the industry to learn how to use it, but the data are there.
3. Automated drone fleets
Today, UAVs are typically controlled by human operators, that have to plan the flight (or use software to do that), go to the field, launch a drone, complete the survey in single or multiple rounds. The scope of the project is limited by a range of the drone and the required resolution.
So if you have a large object to survey, you need multiple drones with multiple operators or one operator that gradually collects data for the whole project area. It complicates the operations in the field, increases the cost and compromises the available temporal resolution (refresh of a given area over time). For some objects like long power lines or pipelines, large-scale drone inspection might not be an option at all.
The developments in drone control technologies will soon solve the problem. Imagine that an operator controls not a single UAV but a whole fleet of dozens of autonomous flying robots. The central system divides the survey area between them. Real-time flight path tracking and dynamic flight recomputation allow the fleet to autonomously correct their route depending on the location of other devices.
Such solutions are currently used by Intel in the entertainment industry but applying it to drone mapping will be a real disruption.
4. Machine Learning in Digital Photogrammetry
‘Machine Learning’ is one of the buzzwords that you can hear and read as often as ‘drone.’ So how about combining these technologies? Recent years showed that Machine Learning is particularly useful for image recognition and could be applied to drone-powered digital photogrammetry.
PwC is one of the pioneers in the field. The company’s drone mapping unit has trained neural networks to recognize multiple object classes and is now applying it to construction inspections. It allows tracking objects, applying safety measures to human behavior and automatically monitoring progress but the possibilities of Machine Learning for drone mapping are endless.

#Business


Next article

For a few decades, paleobiology researchers have tried to answer a question about the evolutionary history of life on our planet. To accomplish this quest, scientists gathered and analyzed thousands of samples from all around the world, trying to find relationships between various species.
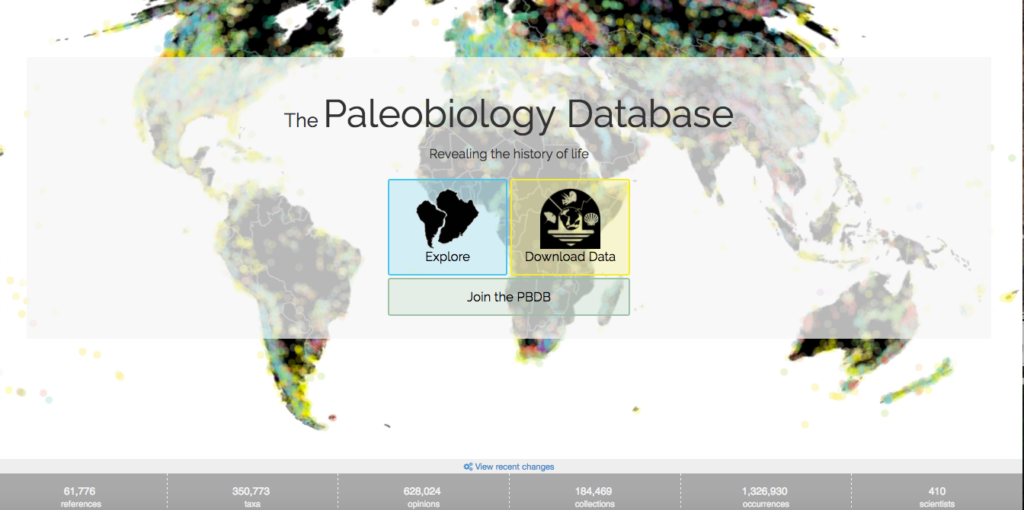
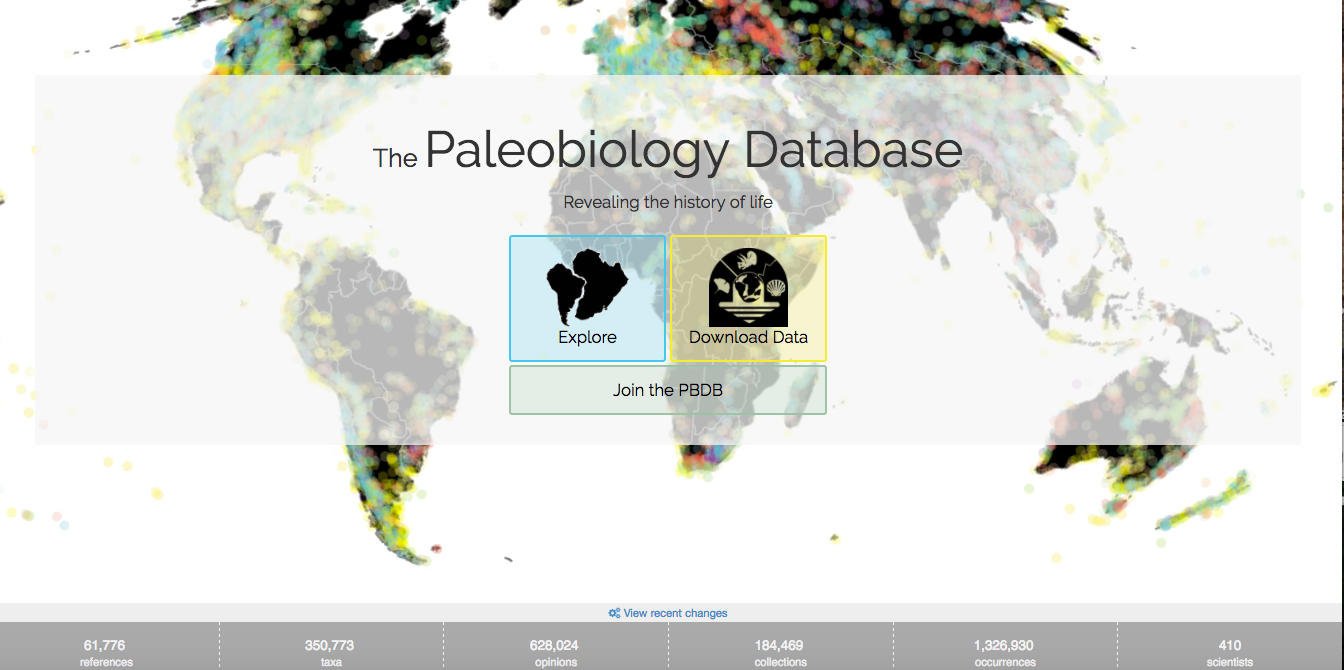
Recently I came across an interesting database tackling this problem in the form of an interactive map. The PBDB Navigator aggregated information about the fossil occurrences from all over the world contributed by over 400 scientists.
When you enter the website, it offers you a few options. You can explore the data, download it to do your own analyses or register and contribute to the project.
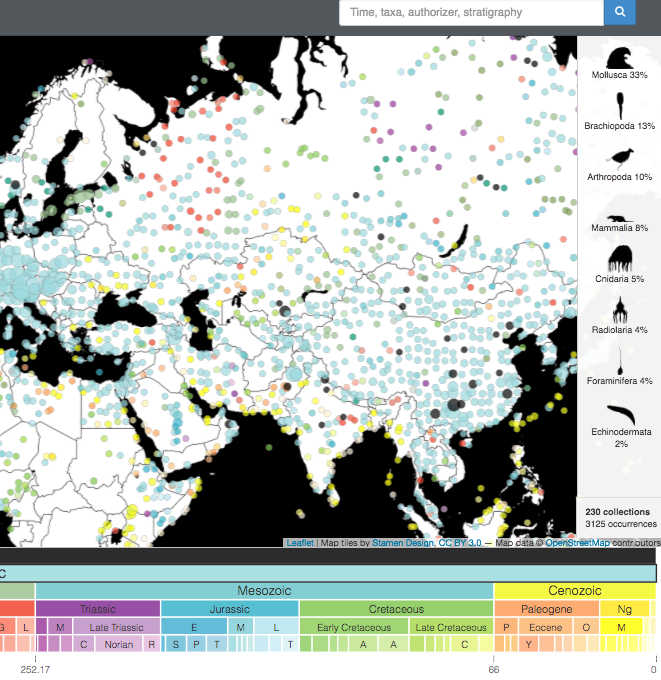
After selecting the exploration option, you will see an interactive timeline that allows you to filter fossil collections by time and displays their paleogeographic locations in the form of dots. Upon closer look, you will see that each of them differs in size and color. The difference lies in the fact that the greater the dot, the greater the number of occurrences in the region. Additionally, the color represents the particular eons.
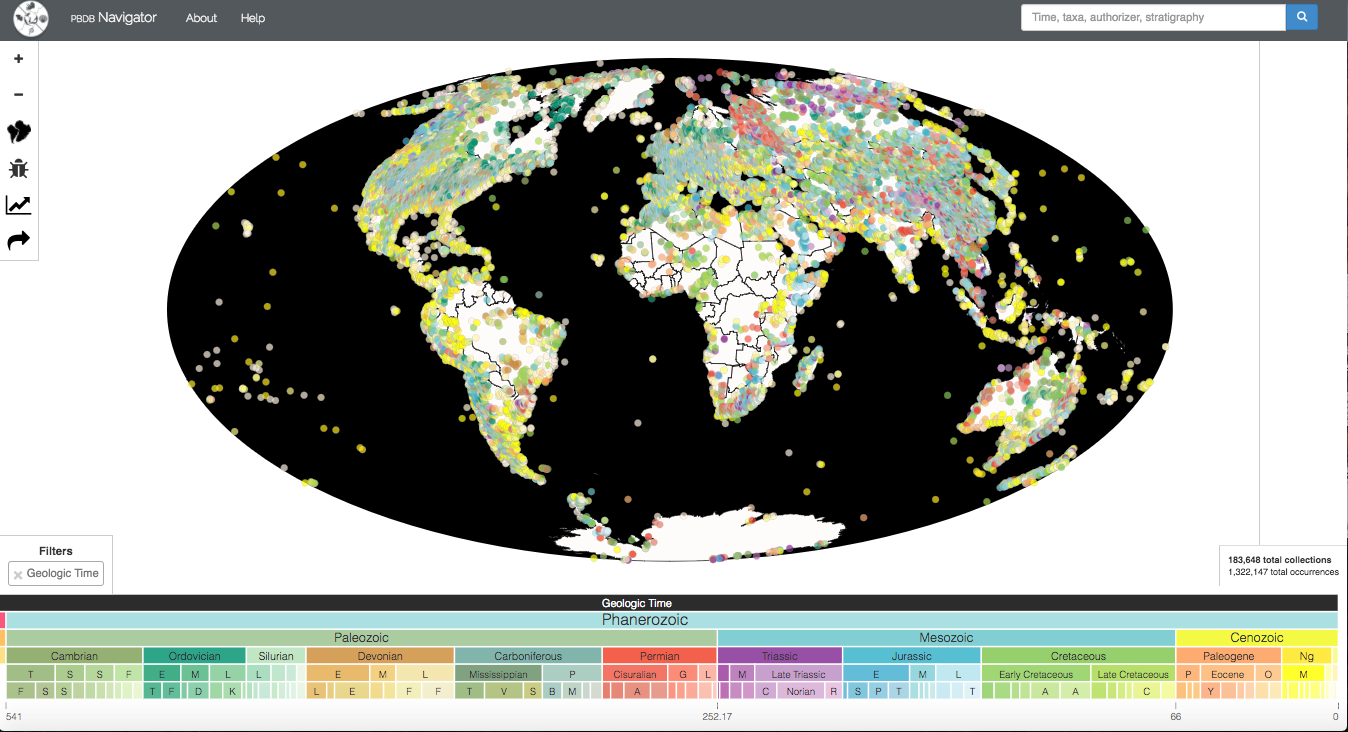
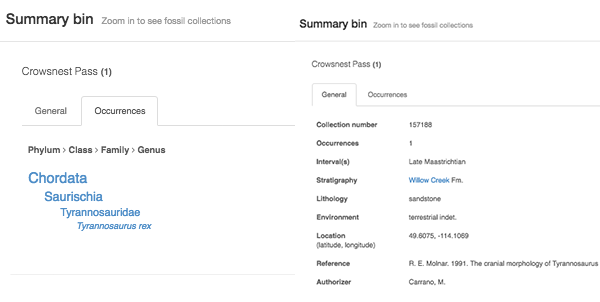
After choosing location and time-span, maps show all collected fossils. Keep it in mind that the closer to the root, the more occurrences we have at our disposal, meaning that by choosing higher time scale you will still have access to lower branches. It works on the same principles as geologic time scale which most of us had at high school. Each dot holds information like occurrences, interval, stratigraphy, lithology, the environment in which it was found, location, reference, authorizer and the taxonomic rank.
On the right side of the map, we can filter desired samples that are divided into the list of animal classes. I like the idea that the filtration of samples and the timeline are closely related to each other. When choosing a particular period, you will get access to the samples that come from that moment in time.
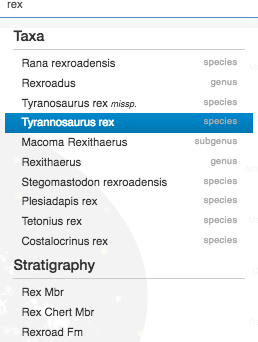
On the right top of the website, developers added a fast search engine. In my case (as a fan of Jurassic World) I was looking for T-Rex fossils.
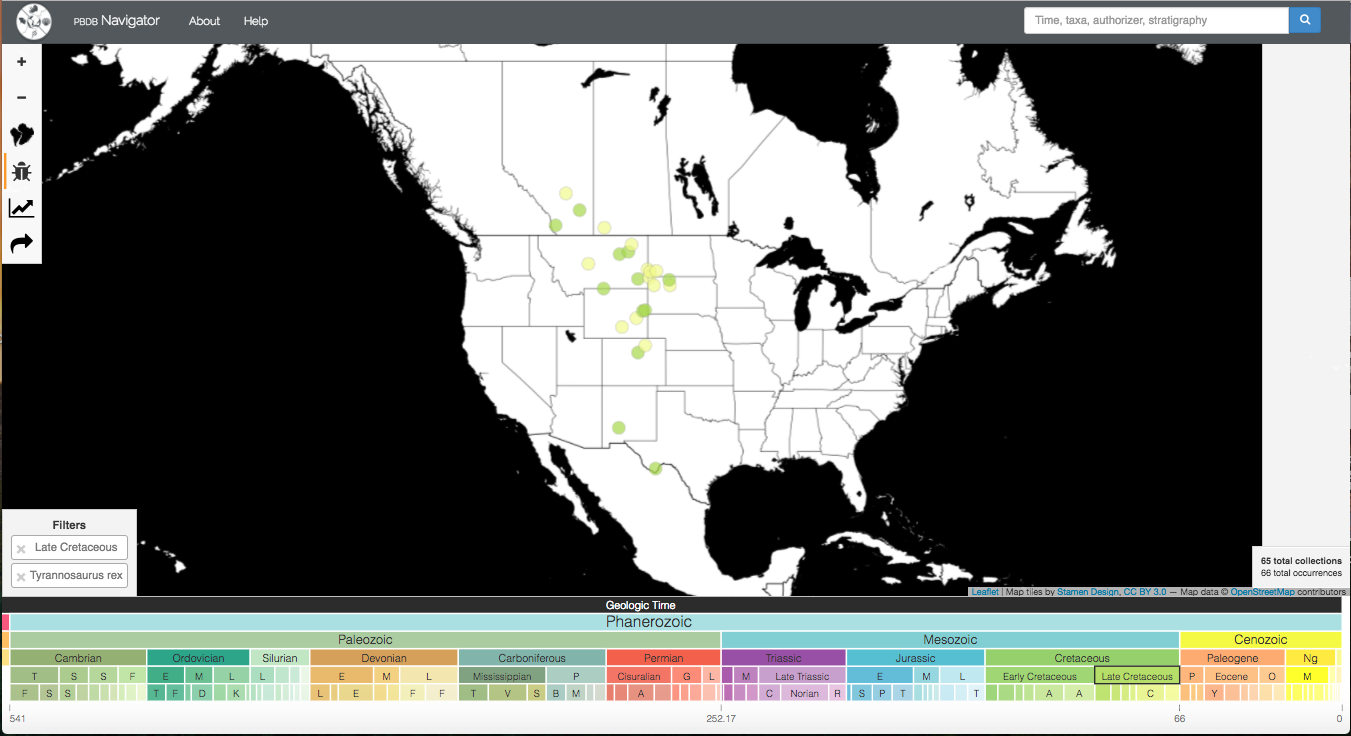
As you can see in the picture below most samples were discovered in North America and they come from Late Cretaceous. To be honest, results look better than I anticipated.
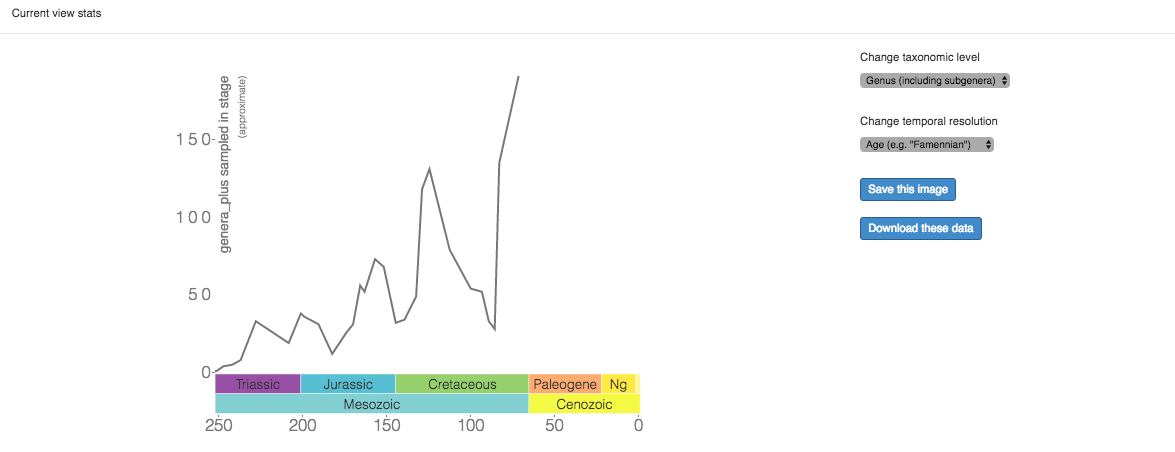
On the left side, you might notice several options like changing projection, fast search, zoom in, zoom out, charts and download button. The overall graphics is quite minimalist, but I really like the charts because they are beautifully crafted. What’s more, you can download images and data charts in well-known formats for your own use!
It’s also possible to provide a shareable link of your work. In the example below, I was curious about a number of occurrences of Saurischia fossils from the Mesozoic era. To make a graph and download all necessary data took me less than a minute! In my opinion, it is a fantastic and powerful tool to explore the data.

Another thing worth mentioning are the datasets. They came from various sources including PhyloPic database, Paleobiology Database and GPlates libraries. Current development of the PaleoBioDB database, API, website, and example applications is being carried out in the Department of Geoscience at the University of Wisconsin-Madison.
The project and its scale are really impressive. Data presented on the map have a unique style and provide relevant information. The graphical user interface is easy to use and makes your job a pure pleasure. As authors said, the goal of the project is to provide global, collection-based data for organisms of all geological ages for independent development of analytical tools, visualization software, and applications of all type. Ultimately, if you are interested in paleobiology research, I would definitely recommend this map. Outstanding project!