
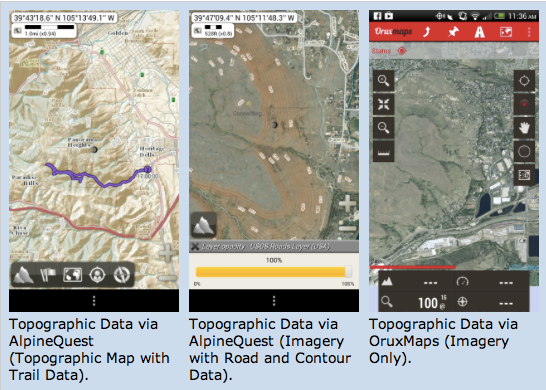
U.S. Geological Survey (USGS) released its topographic maps and data for the use on mobile devices. USGS is one of the major scientific organisations in the US providing information on the processes of the physical environment such as ecosystem, climate and land use change, water, energy and minerals or natural hazards. As such it stores a huge collection of satellite and aerial images from MODIS, ASTER, AVHRR and LANDSAT sensors/satellite to mention some examples. The National Map topographic maps and data of USGS are now available on both Android and iOS mobile devices. The released information comprises the afore-mentioned imagery as well as topographic maps such as road or contour layers distributed by USGS that for instance can be laid over the images. The application proofs to be useful in combination with GPS, when the geographic information of the exact position can be retrieved (and zoomed into maps) while being outside hiking, biking, running, etc. The National Map runs on two Android apps, OruxMaps and AlpineQuest, as well as the Galileo Offline Maps iOS app on iPhone (available at Apple Store). The Mobile Atlas Creator (MOBAC) enables the retrieval of topographic data even when cell coverage is not available and has to be done before going somewhere without data connectivity.
Please, find the installation guide for Android, iOS devices and MOBAC here (source).

#


Next article
Triggered by my interest in remote sensing I have come across the phrase agricultural modelling several times. I perceived the term, but actually did not have a clear idea of what it was about, of its scope, applied methodology and the link to remote sensing. Thus, for me the phrase was a buzzword, and that is why I decided to fill this information gap, in order to strengthen my ideas when mentioned notion is under discussion. I now want to share some of the information I found with you:
Agricultural Modelling
It is well known that remote sensing delivers information on vegetation. Widely applied information packages are vegetation indices extracting information of various spectral reflectances of canopy such as Normalized Vegetation Difference Index (NDVI) that replicates the surface’s biomass (thus also vegetation types) and if observed over a longer time the vegetation dynamics. NDVI is widely used for vegetation assessment, though it has some shortcomings and is exposed to contaminations from other sources. Canopy reflectance models are another choice to derive key vegetation variables such as leaf area, degree of maturity, plant density, content of brown leaves, content of chlorophyll and plant available water (*). Those data can be derived from satellite imagery.
Crop parameters
Canopy cover (Blue: 0% cover, Red: 100% cover) based on LIDAR data. Source: Andersen et al., 2005.
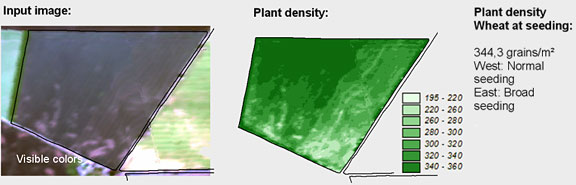
Plant density in a wheat crop. Source: Vista GmbH
Plant growth models
The great number of vegetation indices and canopy reflectance models requires to match the scope of the project to the surface conditions. However, the mentioned products assess canopy properties (expressed as spectral reflectances), from which an estimation of biomass is obtained. From the biomass plant properties and finally the yield can be estimated. The estimation of biomass has to be done several times a year to forecast crop parameters. This outlook is highly desirable and useful for agricultural management. At this point plant growth models, such as PROMET-V, are employed, in order to model the spatial distribution of different crop parameters for a certain time such as the plant growth/development and estimated yield. Those mostly raster based models use information on the terrain, net radiation, hydrological and other meteorological variables as well as afore investigated crop parameters (*) obtained from satellite imagery. The reliability of results lies around 97% on a regional scale and 90% for single parcels.
Summing up,the plant growth model estimates:
- Development of water content
- Progress of photosynthesis
- Development and gain of biomass (roots, leaves, stem, corn)
- Yield
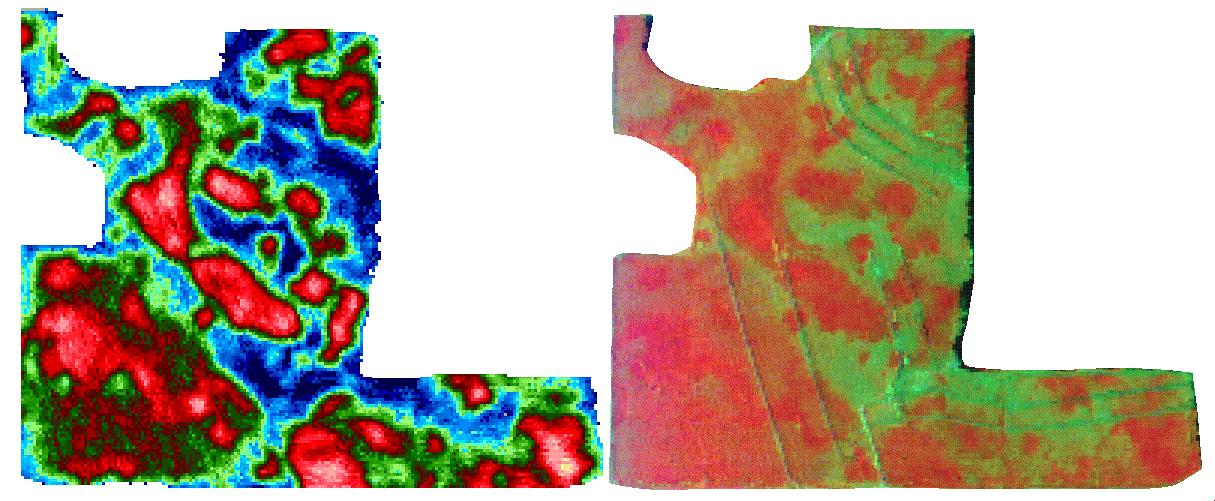
Yield (left) compared to remote sensing image two months earlier (right). Red corresponds to higher yields, blues and greens to lower yields. Source: NASA/Marshall and GHCC.
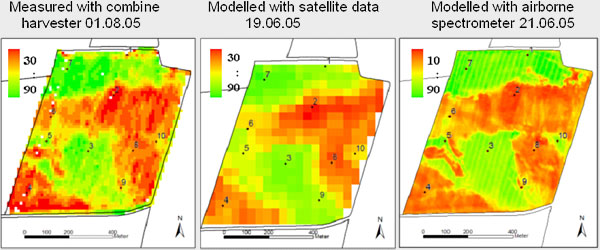
Yield measured by combine harvester (left), yield estimation based on multiangular CHRIS data (hyperspectral and multidirectional satellite sensor; middle) and AVIS data (Airborne Visible Infrared Imaging Spectrometer; right). Both images were taken around 6 weeks before harvest (June). Source: Vista GmbH
Furthermore, the spatial assessment of crop parameters allows the detection of heterogeneities within the planted area. For instance, certain canopy reflectances reveal areas of high and less crop vigor in a parcel, which enables the spatial adjustment of fertilisation. This application of remote sensing in agriculture is called precision farming/agriculture.
Further applications of modelling remote sensing data
- Monitoring of snow cover, estimation of stored water volume and modelling runoff
- Monitoring of floods in time and space
- Monitoring of soil moisture (radar)
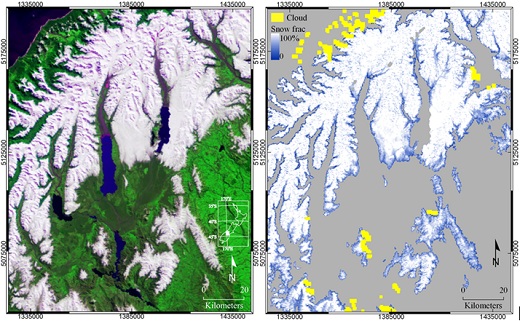
Snow monitoring based on MODIS 250m imagery. The spatial details in the maps were achieved by sub-pixel determination of snow fractions. Source: University of Otago, New Zealand.
Reference:
Andersen, H.-E., R.J. McGaughey, and S.E. Reutebuch. 2005. Estimating forest canopy fuel parameters using LIDAR data. Remote Sensing of Environment 94(4):441-449.