Top 19 geovisualization tools, APIs and libraries that will let you create beautiful web maps

Creating a good web map is not an easy task but over the years we’ve seen plenty of amazing geovisualization examples. Almost all of them have been developed with the use of one of the tools, APIs or libraries mentioned below.
If you think that we are missing something let us know in the comments.
1. Mapbox
Mapbox is a geo-visualization platform that gives easy to use set of tool for creating beautiful web and mobile maps. It offers users a full control over map styling (including background map) and has a lot of cool additional services such as satellite images, geocoding or directions.
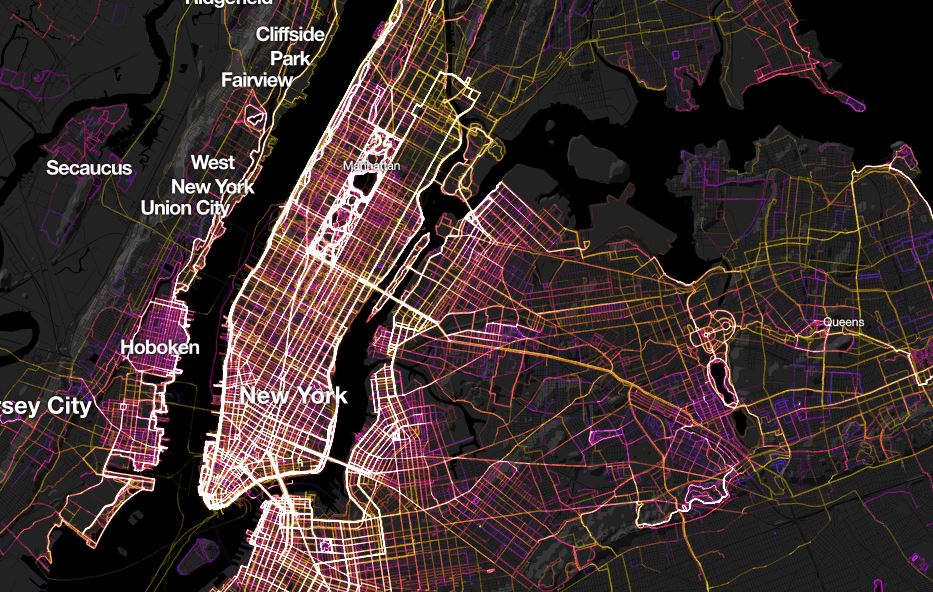
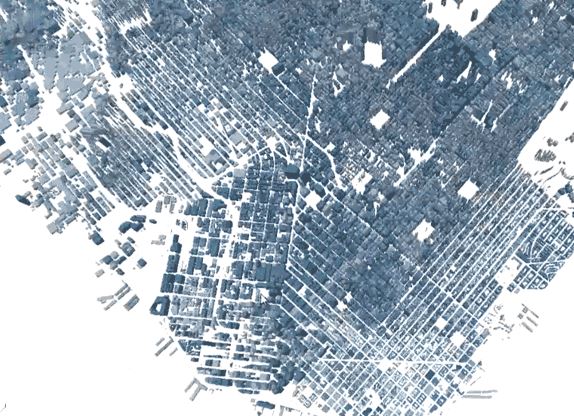
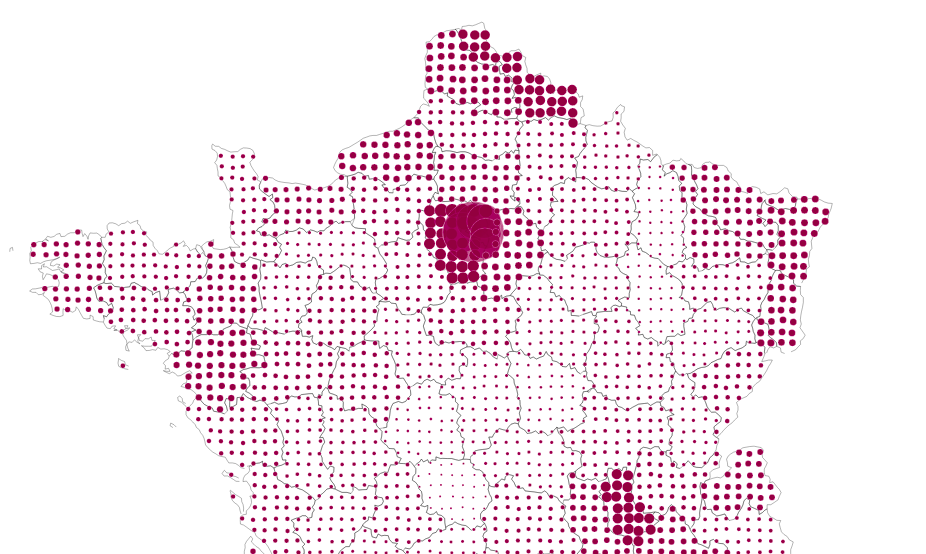
2. CARTO
CARTO previously known as CartoDB is the best platform for complex and dynamic geospatial data visualization and analysis. But don’t be afraid it offers also a lot of drag and drop easy to use tools for newbies.
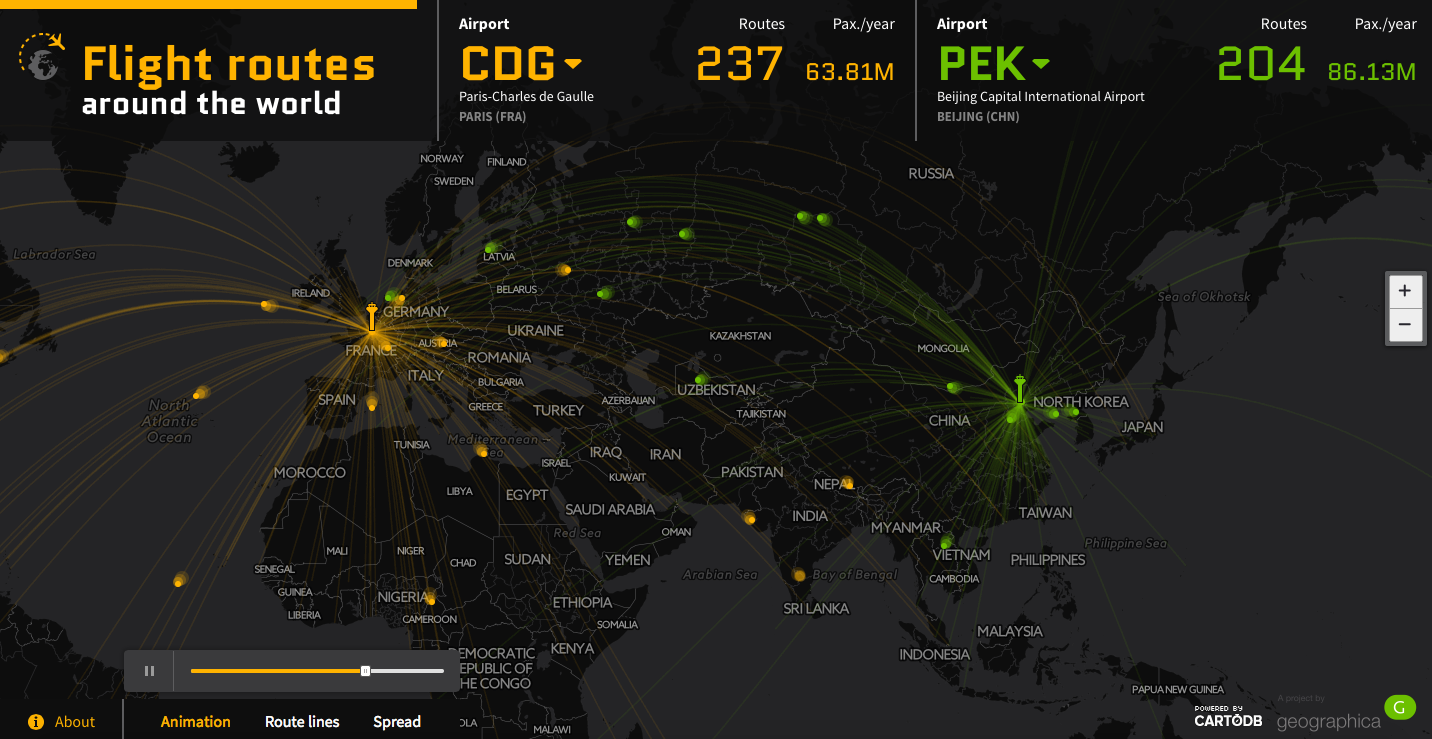
example: Flights around the world
3. ArcGIS Online
Esri has monopolized the field of GIS and is also one of the most popular geo visualization platforms. It offers easy to use, cloud based environment that allows creating beautiful story maps among other.
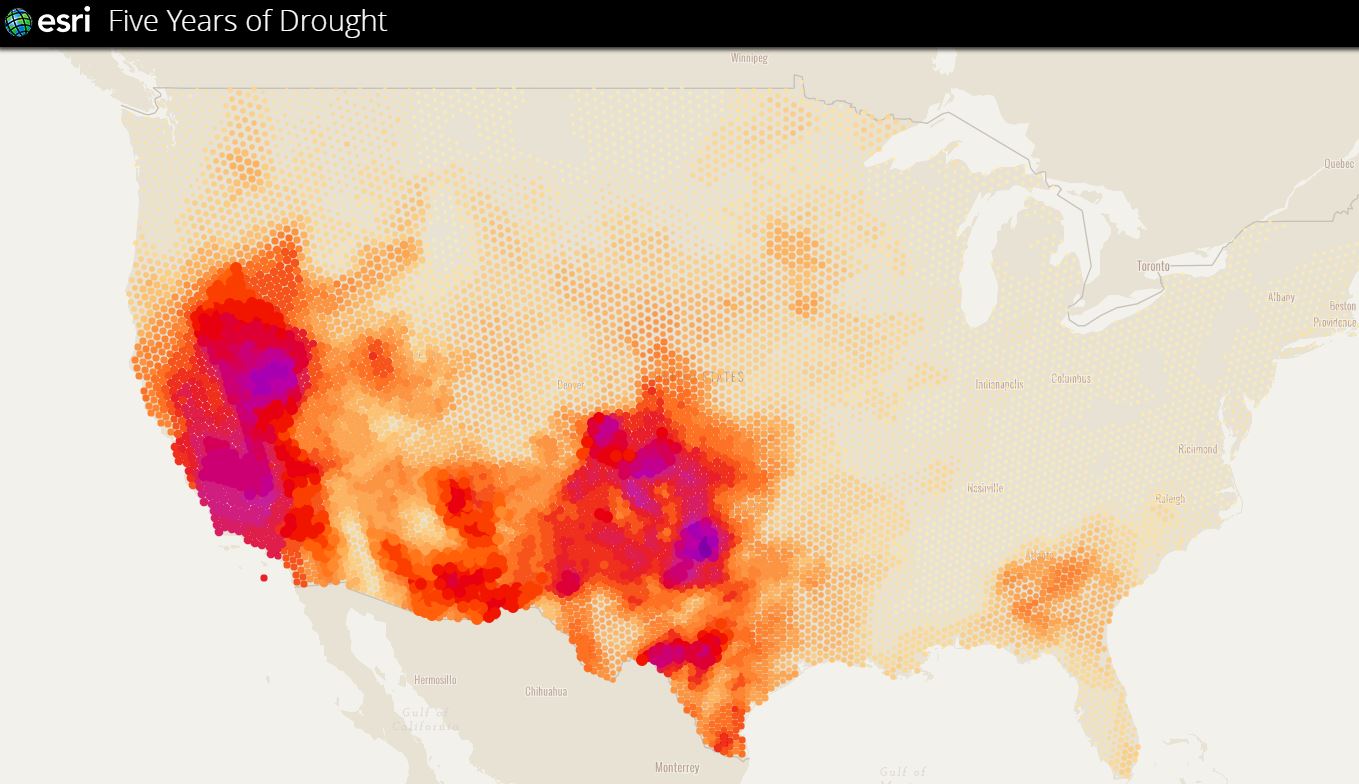
example: 5 years of drought
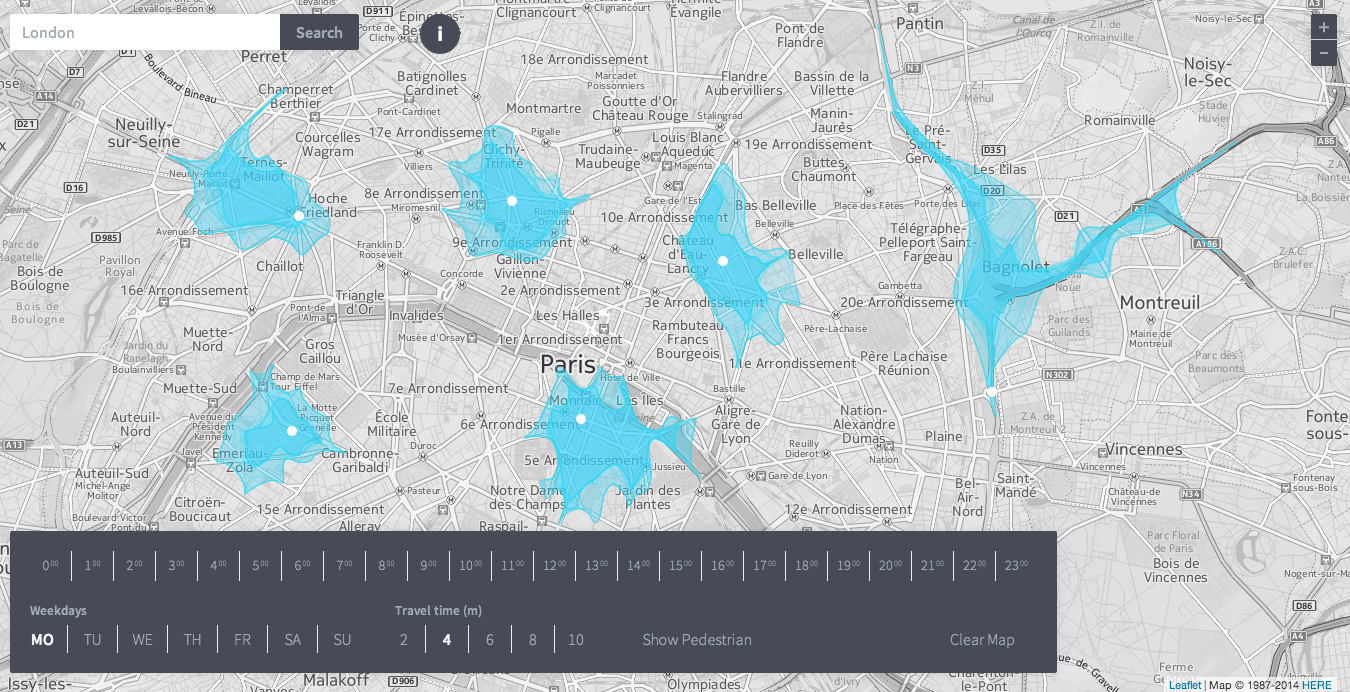
4. HERE Data Lens
Here Data Lens is a set of APIs that provide a seamless developer experience for creation & deployment cool data visualisations. Most importantly it gives you an access to amazing HERE’s maps database with unique features like isoline routing.
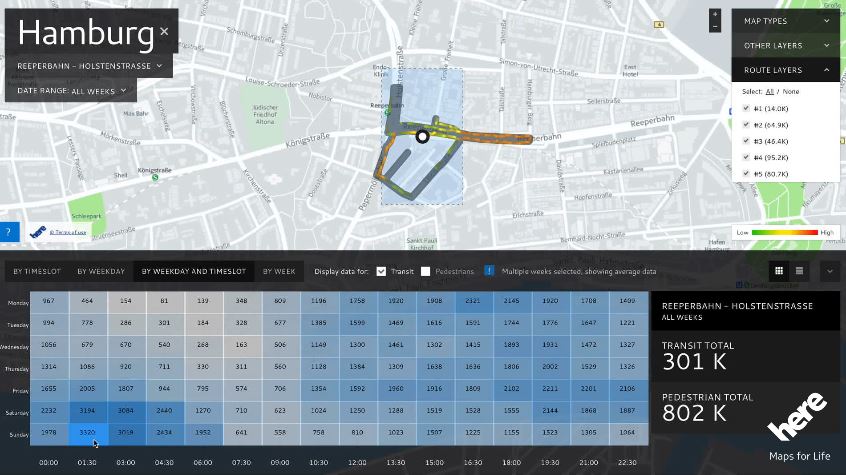
example: Billboard analytics tool demo
5. Google Maps API
Google Maps offers a set of APIs for different mapping purposes. It offers access to Google’s mapping data that includes StreetView among others. You must have used plenty of Google Maps-based app without really knowing about it. Have you played GeoGuessr? It’s also based on Google Maps.
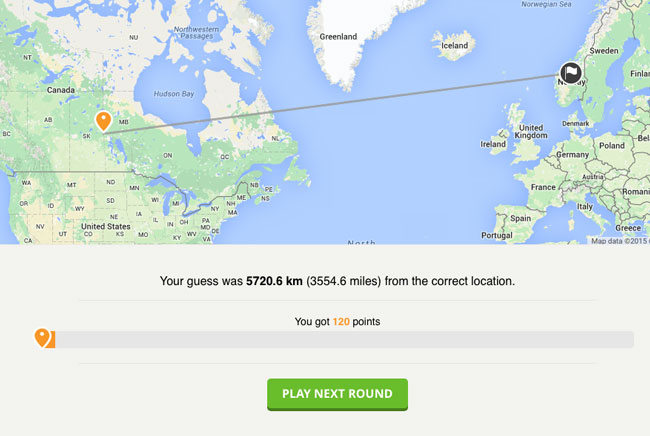
example: GeoGuessr – StreetView based game?
6. D3.js library
D3.js is a JavaScript library that offers powerful data visualization features for producing dynamic, interactive data visualizations in web browsers. In fact many of the top visualizations done in aforementioned platforms also use D3 elements.
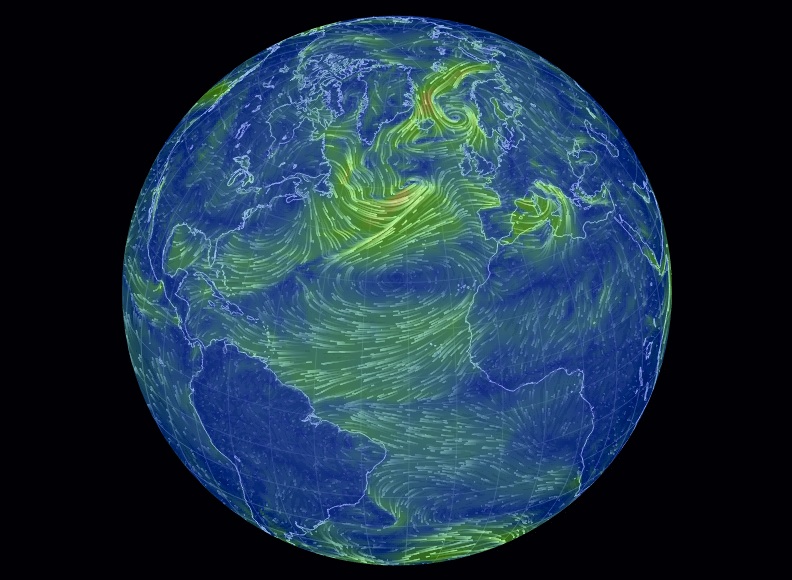
example: Earth wind visualization
7. Leaflet Javascript library
Leaflet an open-source JavaScript library for mobile-friendly interactive maps. If offers really powerful mapping features that commonly used for the best and most beautiful maps.
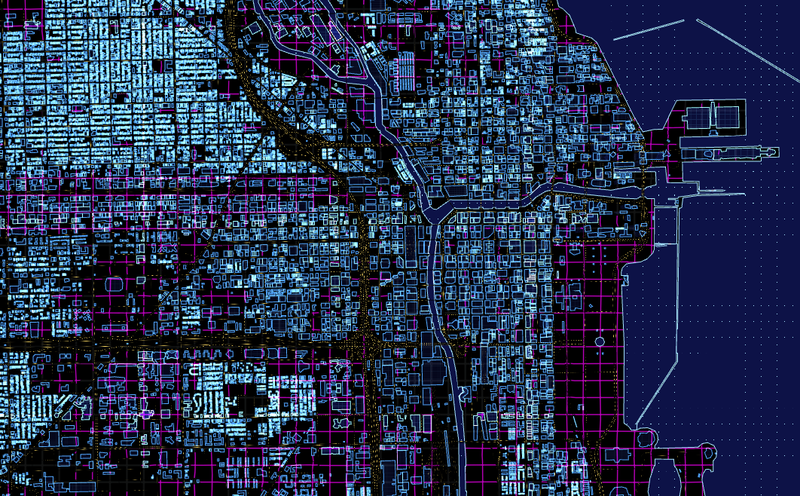
8. OpenLayers 3 (library)
OpenLayers is an open source JavaScript library for displaying map data in web browsers. It provides an API for building web-based geographic app. Similar to Google Maps but for free).
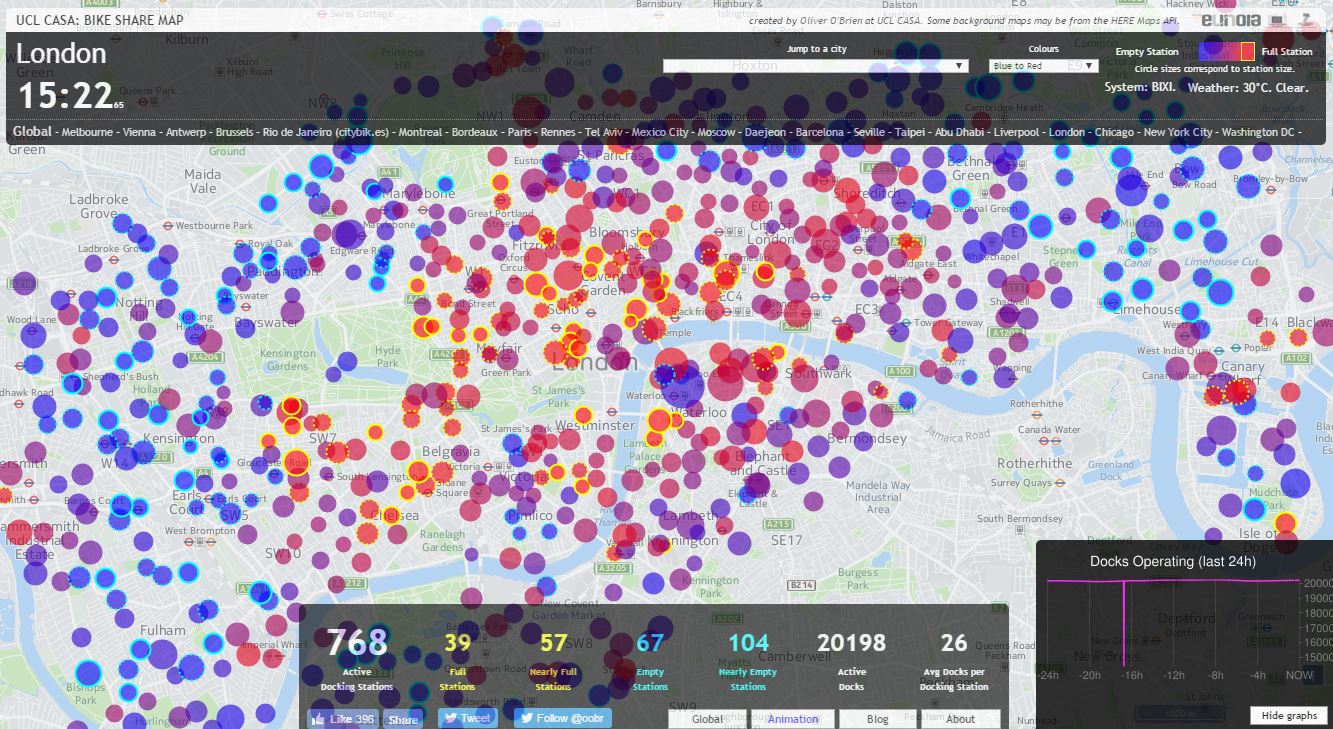
example: Bike sharing map
9. GIS Cloud
GIS Cloud is a web-based GIS platform. It designed for spatial analysis rather than map-based dashboards but it offers the fastest on the market performance as well as other cool features like 3D support.
example: GIS Cloud
10. Mapzen API
Mapzen is a cool mapping company working on some amazing visual projects. It offers some unique and open mapping tools for developers.
example: Mapzen Tangram engine
11. Maps4news
Maps4news is a platform that allows for designing cool looking maps online and downloading them in a vector format needed for printed media (and for editing by designers). There is some basic interactivity that you can add if you want to publish it online.
example: Maps4News
12. Tableau
Tableau is a Business Intelligence and Analytics tool that allows you to easily create interactive data dashboards and understand large data sets. It is not particularly dedicated to geospatial data but it offers quite advanced mapping features when you dig a bit deeper inside it.
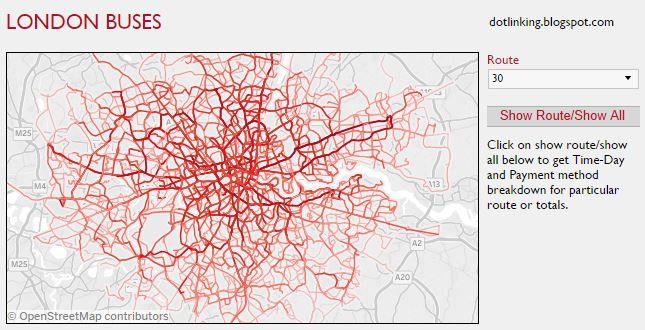
example: London bus routes
13. CMaps Analytics
CMaps Analytics offers the advanced location analytics software solutions for enterprise allowing cool visualisations.
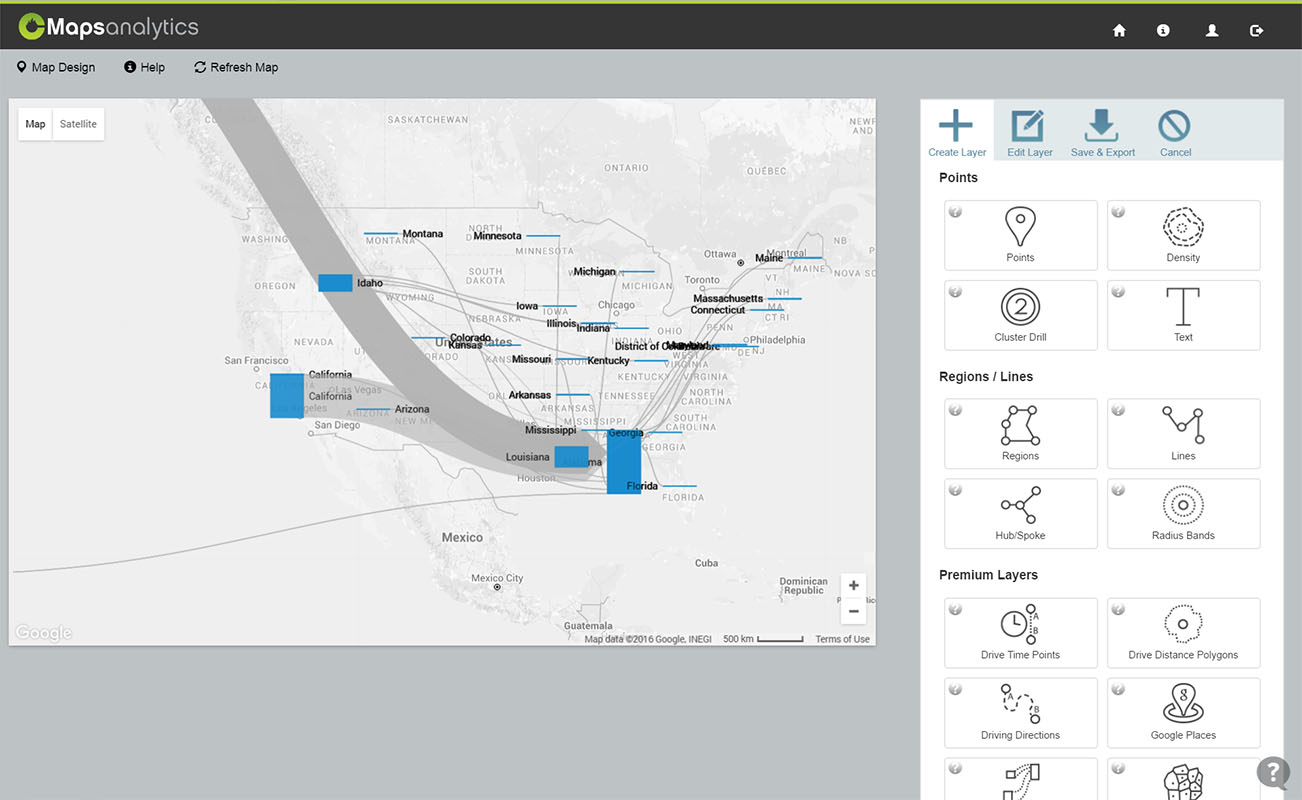
example: CMaps
14. Mapcite
MapCite is a geographic data visualization company that offers both a web mapping and Excel interface for users to analyze their location data.
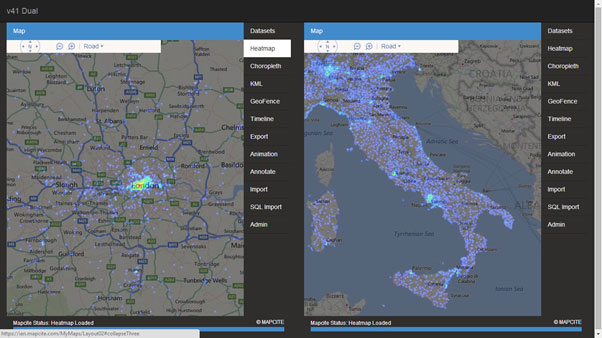
example: Mapcite
15. MangoMap
MangoMap is a simple online mapping environment. It’s not as advanced as other platforms but it can help you with some simple mapping/gis tasks.
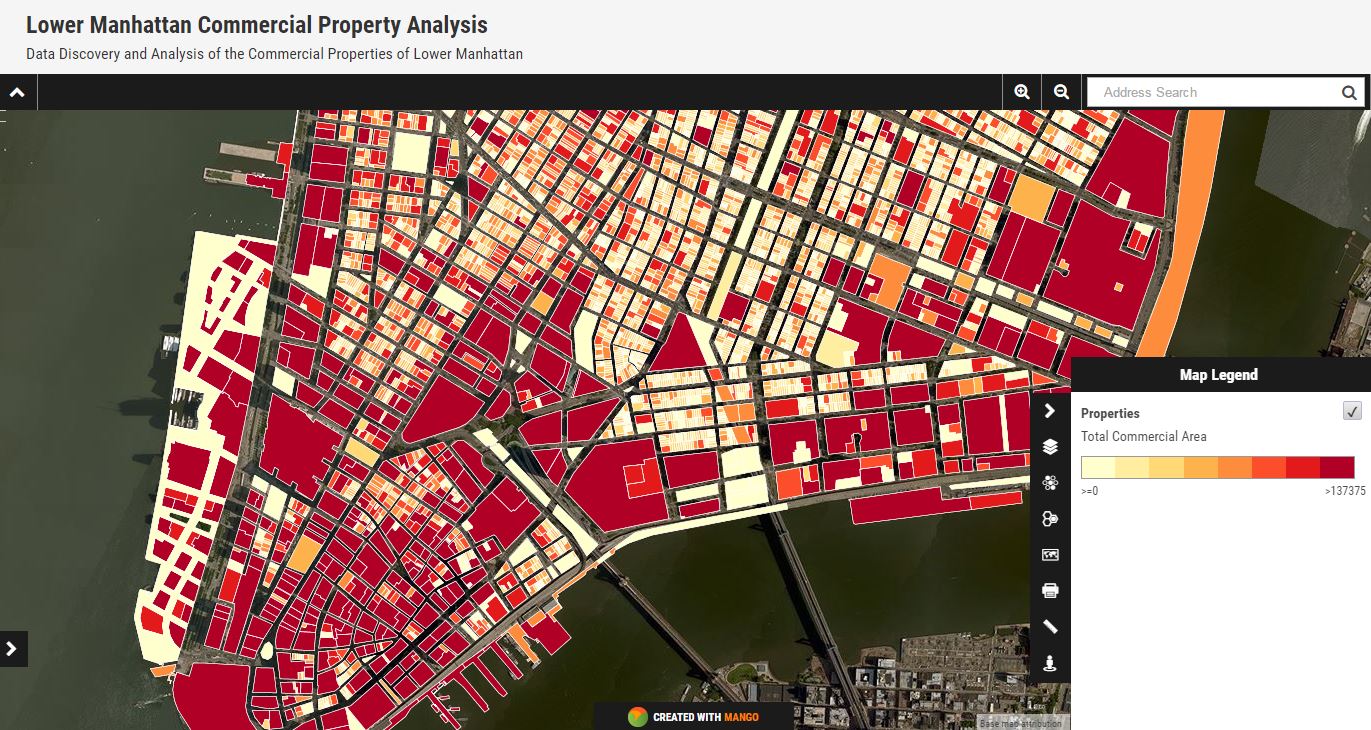
example: MangoMap
16. Tilegram
Simple tool for plotting demographic data on a US county map.
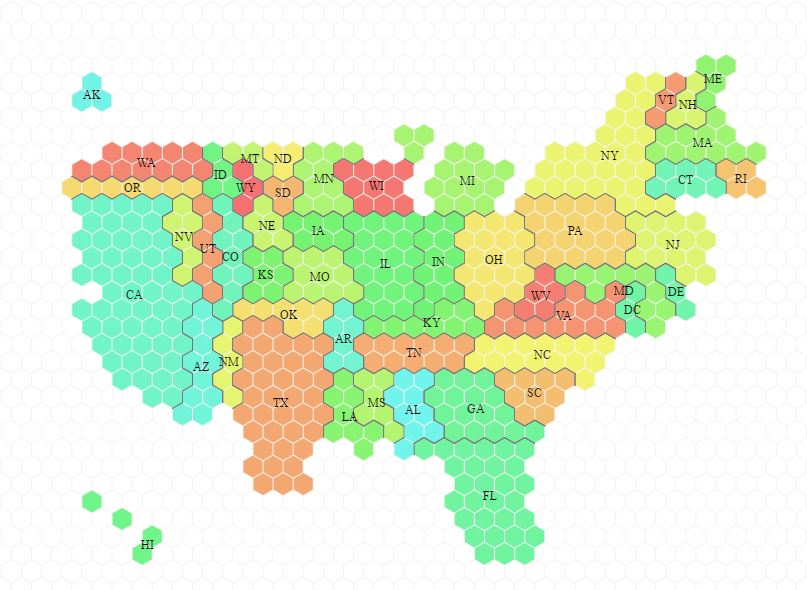
example: Tilegram
17. Infogr.am
Infogram is a web-based infographics platform that allows creating cartogram maps as one of the features. You can olny map maps per country but if this is what you need it’s one of the easiest tools out there.
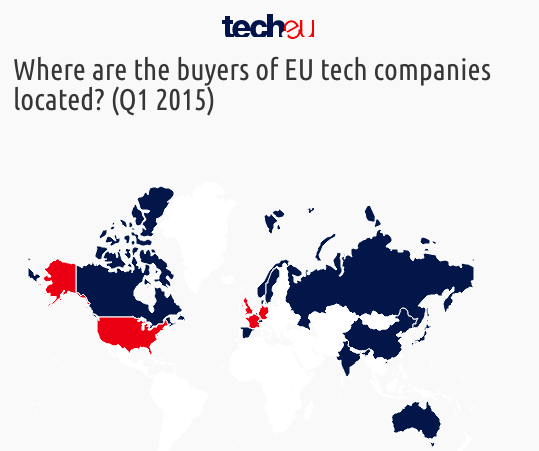
example: Infogram
18. MapStack by Stamen
MapStack is a web-based tool that allows you to play around with OSM background map. You can easily choose one of the main map themes and then modify particular map layers like color, opacity, and brightness.
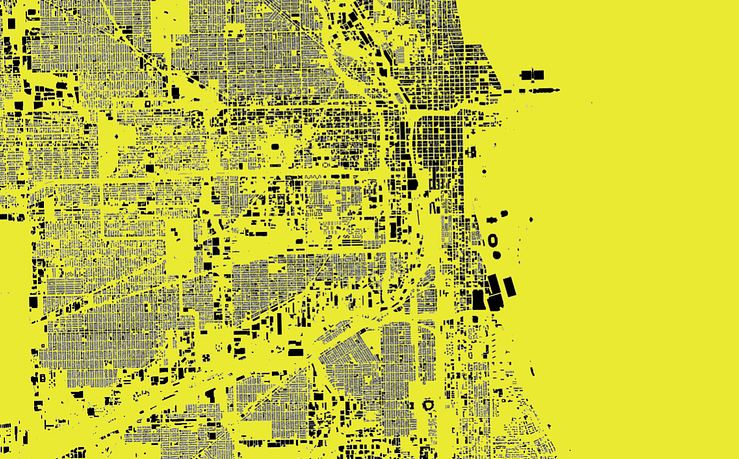
example: MapStack
19. Kartograph (library)
Kartograph is a simple and lightweight Javascript and Phyton library for building interactive map applications without Google Maps or any other mapping service. It was created with the needs of designers and data journalists in mind.
example: Kartograph

#Featured

Next article
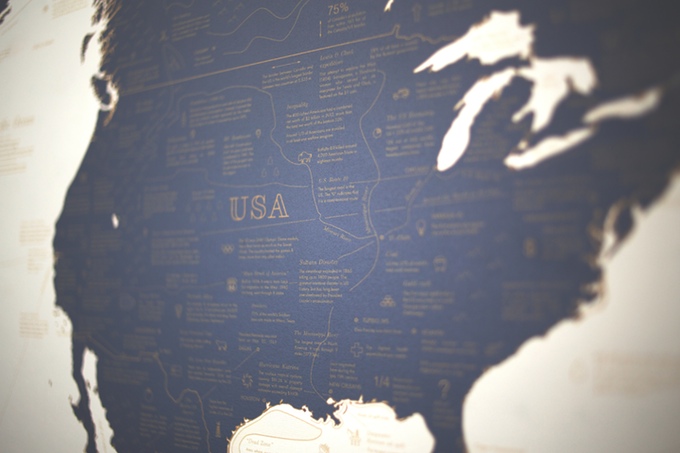
Over the years we’ve seen a lot of cool location-related Kickstarter projects but this one is perhaps the one we love the most. Couple of designers from Poland created an amazing map that shows 1000 fun facts about the nature, history, economy, culture and geography of our planet.
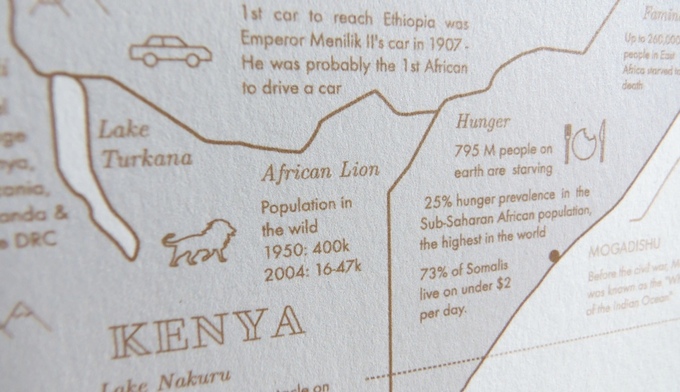
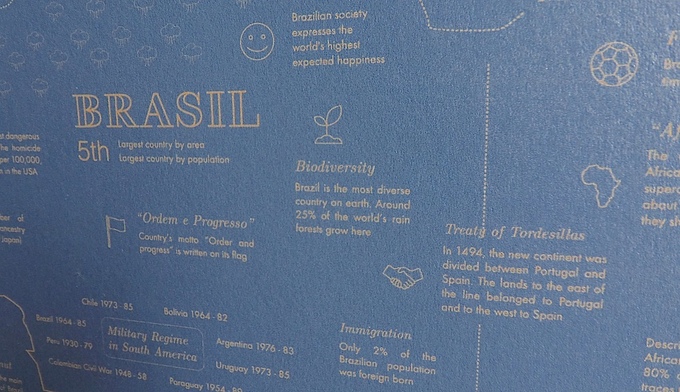
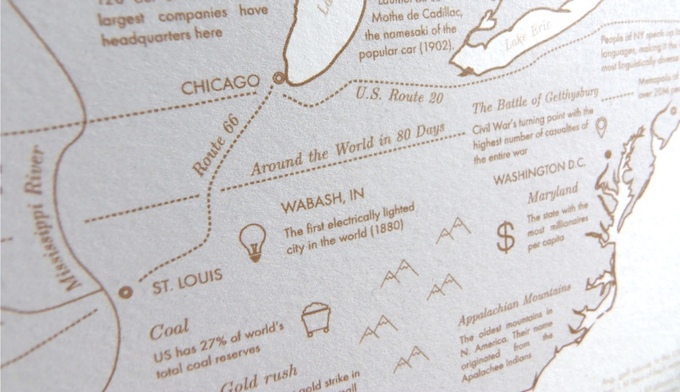
The Explorer’s Atlas looks like an ordinary map from a distance but when you look closer you will notice countless little curiosities, fun facts and trivia about places all around the world. You will learn things like:
- African lion population decreased from 400k in 1950 to 16-47k in 2004
- Brazil is the most biodiverse country in the world with 25% of the world’s rain forests growing here
- Wabash, IN was the first electrically lighted city in the world in 1880
The map is beautifully crafted with a set of small icons and stylish fonts. It’s simply a pleasure to look at it. The map is available for the whole world or for a single continent in light and dark blue color. You can order it via the kickstarter campaign. Cool project!