
Last year the number of active mobile phones crossed the level 7.22 billion, while the number of people is estimated at the level of 7.2 billion. It basically means that there are more mobile devices than human beings and that statistically everyone in the world owns a mobile phone.
What we are not fully aware of, is that each phone call, text message, and each movement of our device creates a huge amount of data. With the development of Big Data tools researches and companies have understood the potential of this data and started to look closer into what can be done with it.
One of the key research centres pushing developments in that area is MIT’s Senseable City Labs. The Lab partnered with Ericsson in order to explore an unprecedented dataset which includes spatio-temporal traces of calls, SMS, data requests (initiated either by the users or background applications), and data traffic from mobile phones in several cities around the world.
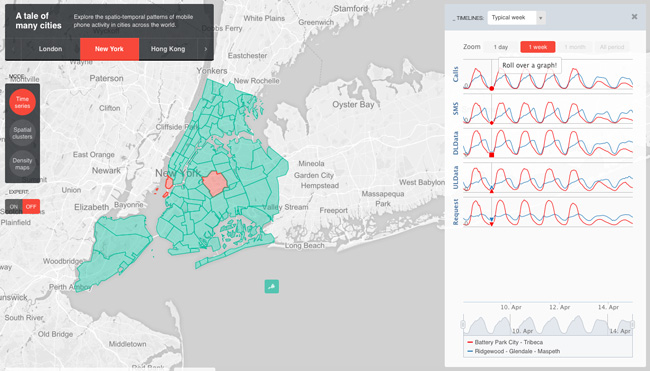
The project called ManyCities visualizes this dataset on a cool interactive map for London, New York, Los Angeles and Hong Kong. The map allows to you to switch between three views. The first one shows how phone usage varies over time, revealing clear daily and weekly patterns as well as longer term trends. The second view shows activity clusters in different parts of cities and by analyzing these clusters, it classifies them per land use (core business, commercial, mixed, residential). The last one allows to view density maps per different mobile phone activities.
This sort of location-based big data, although already commercially used, is under heavy investigation of researchers and companies. We are still lacking of powerful computational tools that can gather, crunch, and present the data in meaningful ways. But with the ManaCities project we’re definitely one step closer.
source: MIT Technology Review

#Business


Next article

A few months ago, I was introduced to CityEngine, a 3D modeling software program from Esri that uses ‘procedural rules’ to quickly generate entire cities. Procedural rules are a shortcut to modelling; you set the parameters and the information for everything from building height to bike lane width, then apply the relevant rule to the pertinent layer. For example, buildings can vary between set heights and styles, and a mix of residential and commercial use specified. Besides being a quick way of generating an entire community, the models generated can contain analytical information such as zoning, square footage or energy consumption.
My approach to this fairly new software is to just dive in and try it, seeing how intuitive the program is.
I found CityEngine to have a fairly steep learning curve, especially if you are not that familiar with modeling and parametric design. Having said that, the program is very powerful and worth the time invested. It differs from many other software programs not only in speed of modelling, but in the powerful analytics embedded right in the model. As changes are made to a design, impacts become immediately apparent.
There are two excellent sets of tutorials provided by Esri, one from 2012 and the other 2015. After watching a few of the tutorials it is quite simple to generate a new city. The challenge is greater setting up specific projects. Here are just a few of the uses I have found for CityEngine as a landscape architecture student learning the software:
1. A simple project using real data.
CityEngine supports a wide range of file formats. I tried importing data from Open Street Maps (OSM). Open Street is open source so it works best with a well-known city, in this case Lower Manhattan. Importing only the building layer resulted in a quick and effective Figure Ground. (See short tutorial here)
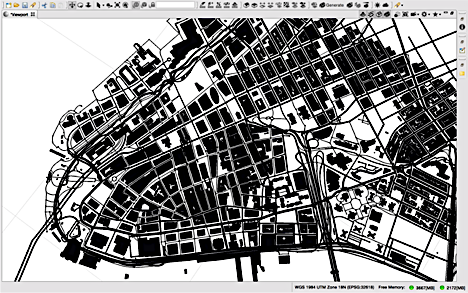
Figure Ground of Lower Manhattan created in CityEngine, Source:Adele Pierre
2. Generate buildings from the 2D shapes.
Working from the previous Figureground, all shapes were selected and OSM chosen in the Inspector window as the height source. Because Lower Manhattan is such a well-documented area, the OSM file was rich in analytical information. Buildings were generated in less than a minute. The scene was then uploaded to ArcGIS web viewer and made public. (See short tutorial here) (web scene)
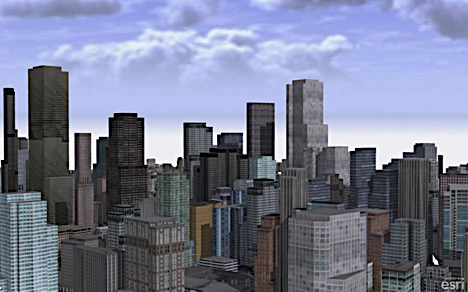
Building Maass of Lower Manhattan created in CityEngine, Source:Adele Pierre
CityEngine specializes in quick model generation, so while the building footprint and height are true, any special features of the building need to be modelled separately. Here is an instance where a few iconic buildings could be modelled in SketchUp, imported into the asset folder of the relevant CityEngine project, and dragged and dropped right into the model. With a few of these additions, you can have a believable skyline and building mass model in a short amount of time.
3. Create a small Geodesign project using available GIS data
The next step, and current project, is to create a design for an existing urban streetscape that will provide some much needed greenery as well as aiding stormwater infiltration.
The project is near the industrial area of Hamilton Ontario, Canada, on Ottawa Street North. Given the neighbourhood, this is an area that has had very little attention from open source mapping. To obtain relevant information, I browsed the City of Hamilton Open Data portal, to download shapefiles. Most cities now offer this service, and anyone working in the field of Geodesign can easily find a wealth of information.
Shapefiles are very large, so while they can be imported directly into CityEngine it is more efficient to load the files into a GIS program first and select the area in which you want to work.
I have loaded the buildings, streets, parks and parking lots into CityEngine.. Before continuing the model, I will be consulting with businesses and residents to get their thoughts and ideas on creating a greener streetscape. After collecting all relevant data I will go back to the model to create procedural rules for bioswales and green roofs. New CGA (Computer Generated Architecture) rules can be written, or existing rules edited to accomplish the same task.

Existing cga rules can be easily edited; Source:Adele Pierre
After adding these elements to the model, it should be possible to calculate some of the resulting impacts both in cooler paved surfaces, and better storm water infiltration. Once the model is uploaded to a web scene, stakeholders will be able to view the design and make comments.
Ottawa Street North is a neighborhood with a strong historical sense of place that is undergoing significant change. Using a strong visual model rich in data should help make that change both welcome and understandable to the community.