
Before we take a look at the process, I would like to acknowledge the obvious: Any list is biased/flawed at some level and this list isn’t any different. That being said, Geoawesomeness is extremely proud of all our panelists and I am personally indebted to all of them for spending hours and hours reviewing the companies and providing their opinions with complete professionalism. It was a labor of love for all of them.
This may not be the absolute Top 100 Geospatial Companies and Startups list in the world, but it is certainly the Geoawesomeness Top 100 Geospatial Companies and Startups list.
Why Top 100? What is the purpose?
In addition to recognizing geospatial companies that are doing good work, the Top 100 Geospatial Companies and Startups list are intended to showcase the length and breadth of the industry and to serve as a reminder that geospatial applications and services are used by a wide variety of customers. Once this list is published, we intend to publish details about all the companies in our database and to maintain/update it regularly.
How did you decide the Top 100?
We assembled a panel of 16 people working in the industry to help us review the companies and come up with the Top 100 Geospatial Companies and Startups list for 2019 (Meet the panelists). The process was rather straight forward. Each member of the panel reviewed the companies giving them a “Yes” or a “No”. Each panelist also had the opportunity to nominate one company as a “Must be Included”. A “Yes” meant 1 point for the company and a “No” meant -1 point to the company. In the end, we totally the votes and the 100 companies with the most votes made it to the final list.
Comparing Apples and Oranges?
How do you compare say for e.g. Uber with StreetCred? Or a company in South Africa with a company from Germany? Well, honestly, it is an apple to oranges comparison. We left it to our panelists to review each of the companies and then decide whether they deserve a place on the list.
Which Companies were considered?
The panel reviewed all the companies that were part of the original (2016) Top 100 Geospatial Companies and Startups list compiled by Aleks together with all the companies that submitted their details as part of the campaign to update this list (Related: Help us identify the Top 100 Geospatial Companies and Startups). Around 200+ companies were reviewed.
A big THANK YOU!
Last but not the least – I would like to take this opportunity to acknowledge and thank all of our panelists – Denise, Katie, Rohini, Miriam, Paula Julia, Paula, Aleks, Alex, Iyke, Alberto, Louis, Steven, Will, Sajjad, and Javier for their support. This list wouldn’t exist if not for them!


#Business


Next article

Over the past few decades messaging took over communication, broadcast video shifted to on-demand video, and operating systems took on entirely new forms in a mobile world. Yet, mapping software tools remain mostly unchanged. We built tools to make satellite-based maps faster, prettier, and easier to consume across web and mobile. Yet, the dominance of satellite imagery meant that innovation around mapping tools stagnated.
Mapping is changing because the primary mapping data source is no longer satellite imagery. Video, LiDAR, radar (all together ‘VLR’) and derived Machine Learning data are becoming kings of mapping data. Said another way, the eyes at the edge (VLR) are contributing the vast majority of mapping data with few mapping applications taking advantage of it. This means the mapping pipeline to ingest data from VLR sensors and mapping software tools we use for mapping and geospatial analytics must change.
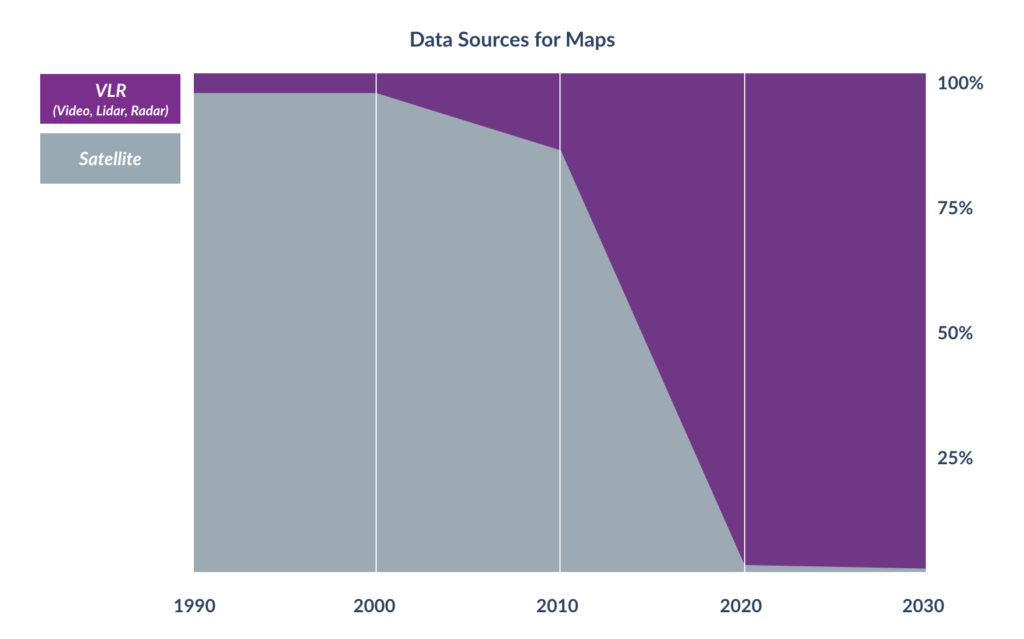
Data sources for Maps in the future: Video, LiDAR, RADAR (VLR)
Spreadsheet for chart above is here
As millions of new VLR sensors are deployed today’s static satellite-based mapping software will fall farther and farther behind. The time is past due for a new model of map that can adapt to modern needs; a living, machine-generated map. As we build living maps for the modern world of connected VLR sensors a few key principles must be followed:
Living maps must grow on their own
Living maps cannot rely on humans to say that a construction crane is no longer present, a truck delivery location is blocked by construction, or that a building roof has been damaged by fire. Instead they must grow on their own from an array of VLR sensors deployed across cars, drones, and airplanes.
Core to the process of building a living map that grows on its own is GeoRegistration ー the process of fusing multiple unsynchronized collections. I’ll give you an example, when 1,500 cars, 10 drones, and 1 airplane are collecting video and Lidar across San Francisco the GeoRegistration technology must automatically combine all of this data into a single combined and accurate 3D map. If you don’t automatically align all these data sources to an exact coordinate in the real world then you have something pretty to look at, but you certainly don’t have a living map capable of growing on its own.
By automatically, GeoRegistering all data coming from VLR sensors, the living map can now confidently update itself to reflect changes such as a terrain shift, a sidewalk addition, and new light poles.
Living maps see and reveal changes
Most maps are pretty. Few maps are pretty and useful.
Like good eye candy, a static satellite map of Paris is enjoyable for a few moments. While a living map of Paris precisely understands how each city block, building, and street sign has changed in the last five hours. By automatically seeing and revealing changes taking place a living map can be used effectively for:
- Smart Cities — what Stop signs are visibly obstructed increasing the risk of an accident?
- Defense – does the supply route have any obstructions posing a security threat?
- First Responders — how many residential parcels have been damaged and citizens displaced?
- Oil & Gas — are changes to service roads after rain causing unsafe driving conditions?
- Financial Services — what is the demand of all-electric charging stations across the US?
- Insurance — which neighborhoods are hardest hit after a disaster and need the quickest support?
A living map is aware of its history and understands important changes taking place in the physical world. Users can watch changes play out before their eyes helping them gain valuable insights into how a city, park, building, or road is changing.
A living map automatically detecting changes to a residential neighborhood after the 2017 Santa Rosa fires.
Living maps must ❤️ spreadsheets
The truth is most enterprise users don’t need pretty map visualizations on a daily basis, yet they do need the data locked away within those maps.
Therefore, a living map is less about pretty pictures and more about spreadsheets and tasks generated from maps. Machine learning enables software to extract bite-sized information from large maps and automatically generate actionable information that can be delivered to enterprise users in a spreadsheet like experience. By blending the power of spreadsheets with the visualization of maps into a single application mapping data will be made available to far more enterprise users.
For example, UPS logistic planners don’t need to look at a new map of Palo Alto each day, instead they need to know what changes have occurred (e.g. construction at delivery location) that will impact the efficiency of their Palo Alto routes.
How change detection is helping UPS workers navigate everyday
Living maps will replace static based satellite maps
Fueled by the growth of VLR sensors living maps like Hivemapper will replace static satellite-based maps. Just as we look back with nostalgia at paper based maps we’ll one day do the same for static satellite-based maps.