
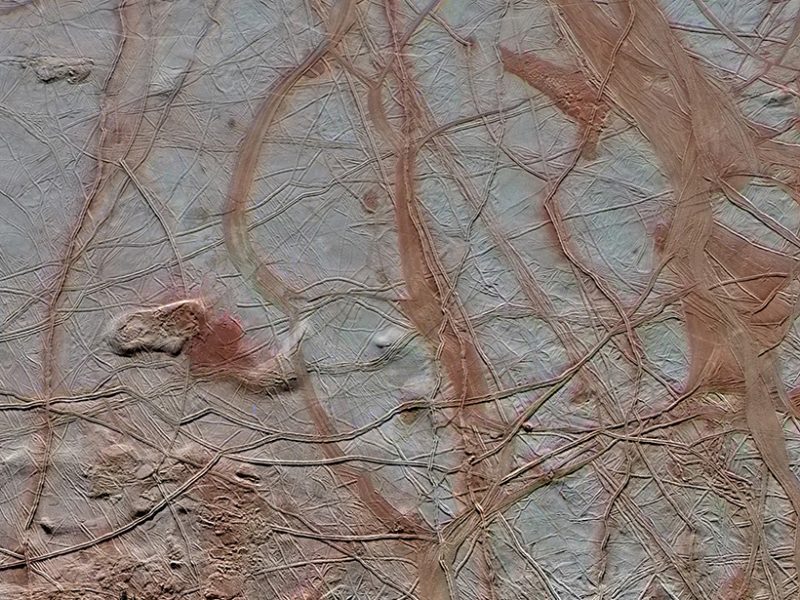
Credit: NASA/JPL-Caltech/SETI Institute
For the scientific community, Jupiter’s icy moon Europa is as puzzling as it is fascinating. One of the most geologically complex satellites of our solar system, Europa is believed to be hiding a saltwater ocean beneath its icy crust. Naturally, NASA wants to conduct a detailed investigation of the moon to find evidence of the water and gain insight into the potential habitability of this mysterious world.
The Europa Clipper mission, which is already in formulation, plans to do just that. Only, before an orbiter or lander can be sent to this moon which is only slightly smaller than ours, NASA needs to know where to land its spacecraft on surface covered by bounteous cracks, ridges, bands, etc. In other words, they need a map. And now, they have one, courtesy D. Alex Patthoff of Planetary Science Institute and his colleagues at UCLA, Wheaton College, and NASA’s Jet Propulsion Laboratory.
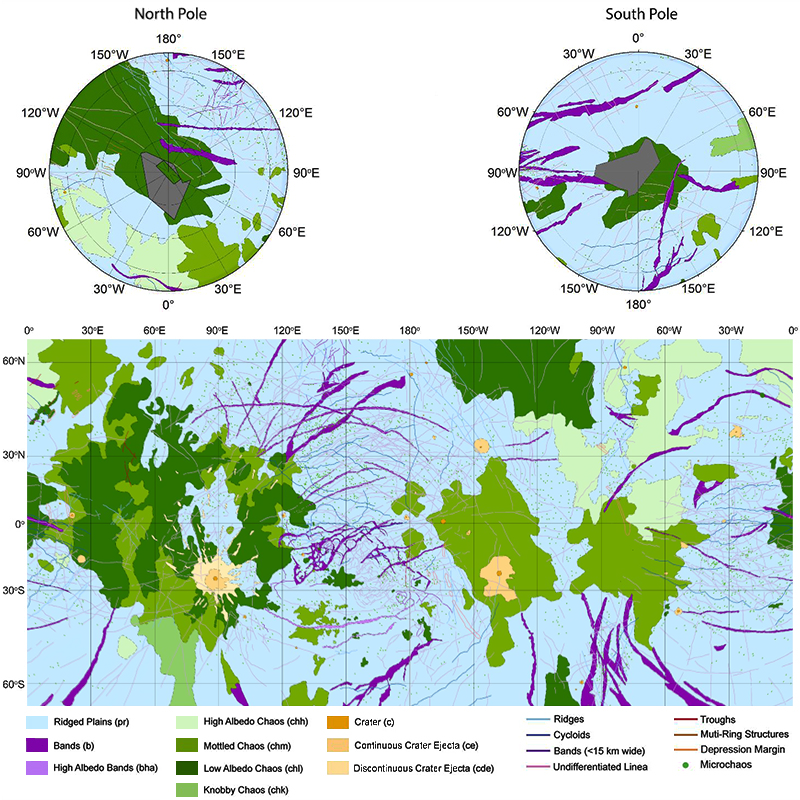
Credit: NASA/Erin Leonard, Alex Patthoff, and Dave Senske, building on work by Ron Greeley, Thomas Doggett and Melissa Bunte
The map, which was unveiled this week at the annual meeting of Geological Society of America, is a result of the imagery collected by the Voyager and Galileo missions. After stitching together more than 100 images from these missions into a mosaic, it took weeks to ascertain and catalogue the various structural features of the satellite, the authors told Eos.
Creating the geological map was especially challenging because in addition to the complex surface of the moon, the variable lighting conditions and image resolutions from the Galileo solid state imager (SSI) data set made it difficult to differentiate between features like a ridge and a crack. But now, the finished product not only identifies individual units like chaos, bands, ridged plains, and craters, it also depicts structural features like ridges, cycloids, undifferentiated linea, crater rims, depression margins, dome margins, and troughs. The map has been created at the scale of 1:15 million.

#Ideas


Next article


Evolving from the ancient Celtic holiday of Samhain, modern Halloween has become less about literal ghosts and celebrating those who passed away and more about costumes and candy. Below you’ll find the collection of the best maps and infographics that will let you understand Halloween a bit better.
How countries around the world celebrate Halloween
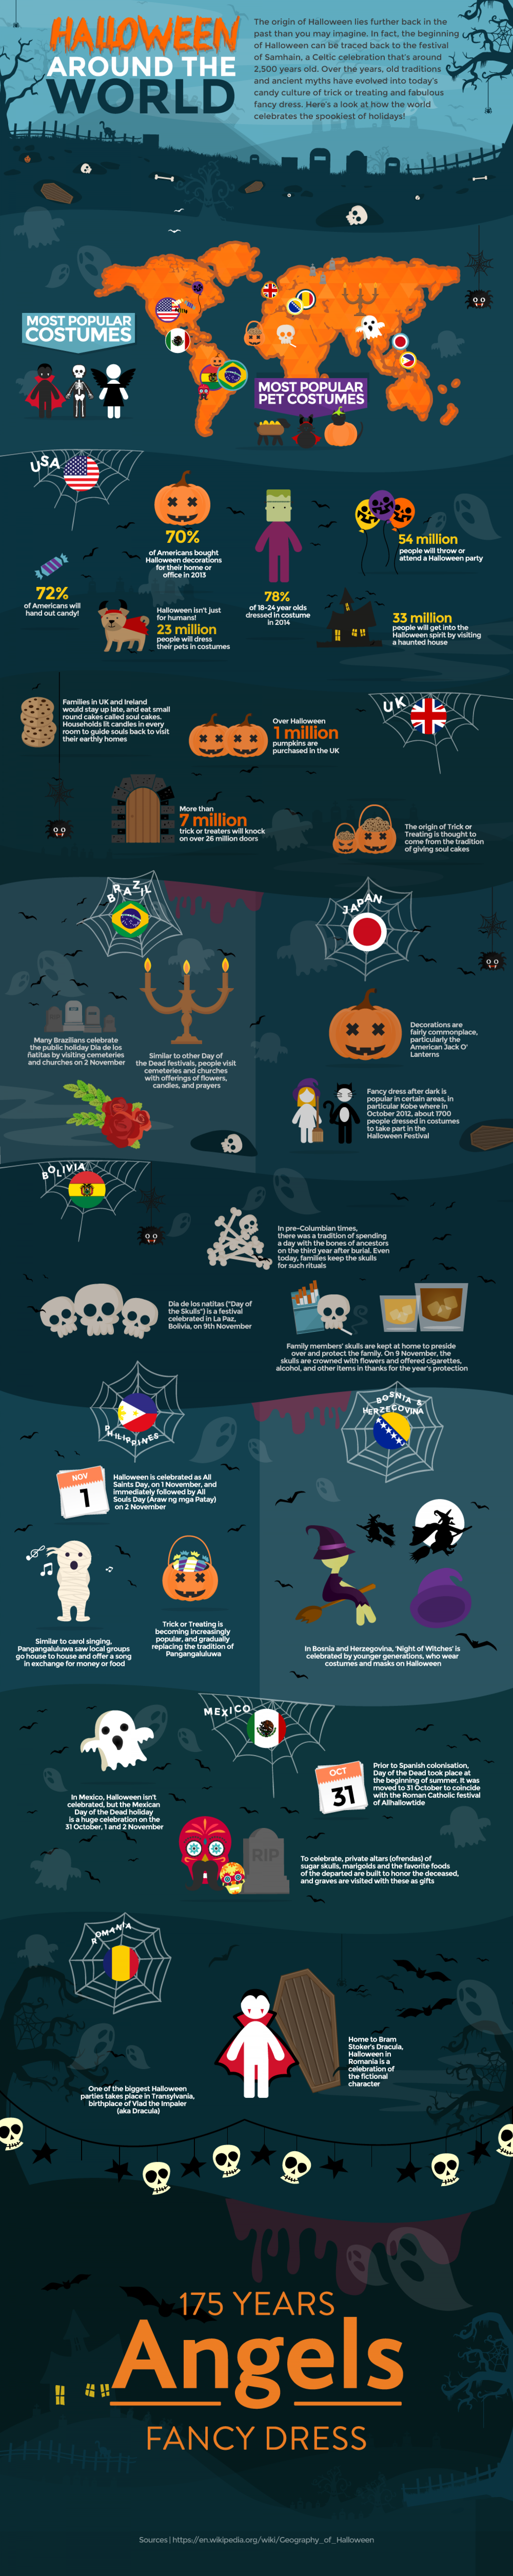
source: Angles Fancy Dress
The acres of harvested pumpkins by state
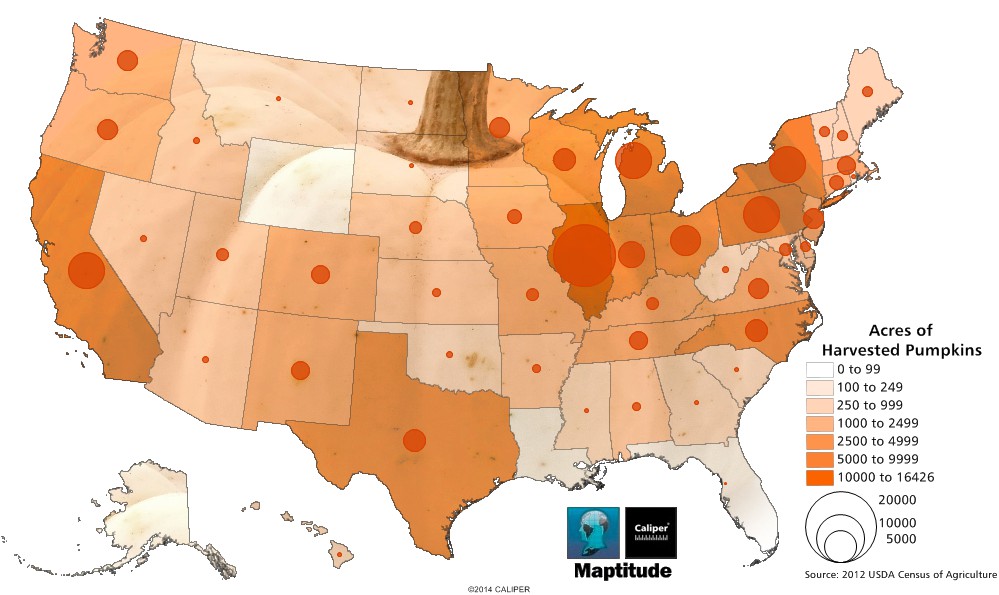
Maptitude Mapping Software Pumpkin Harvest Map
source: Caliper
Countries with candy import peak in October
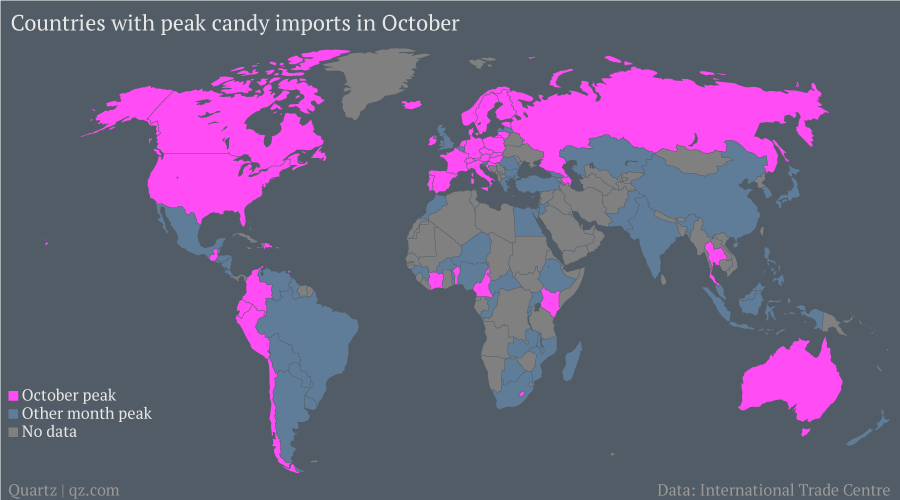
source: qz
The most popular candies per states
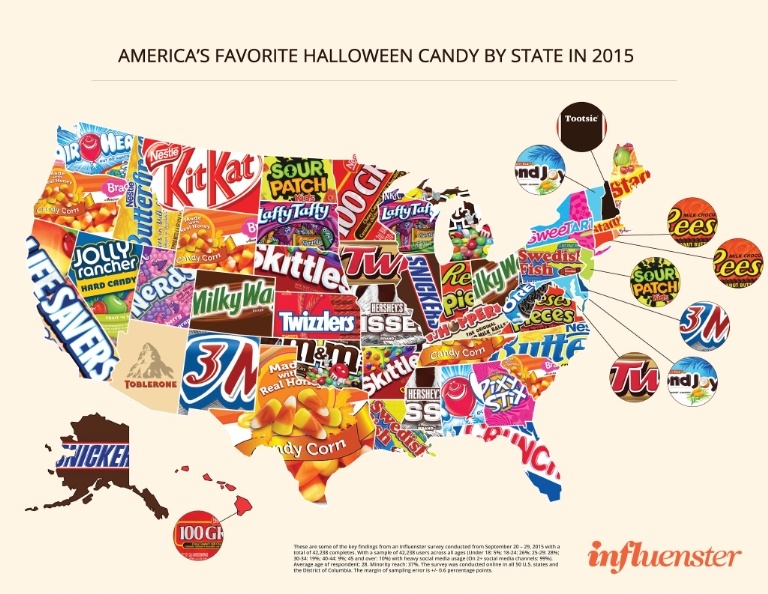
source: Cosmopolitan
The Most Googled Halloween Costumes
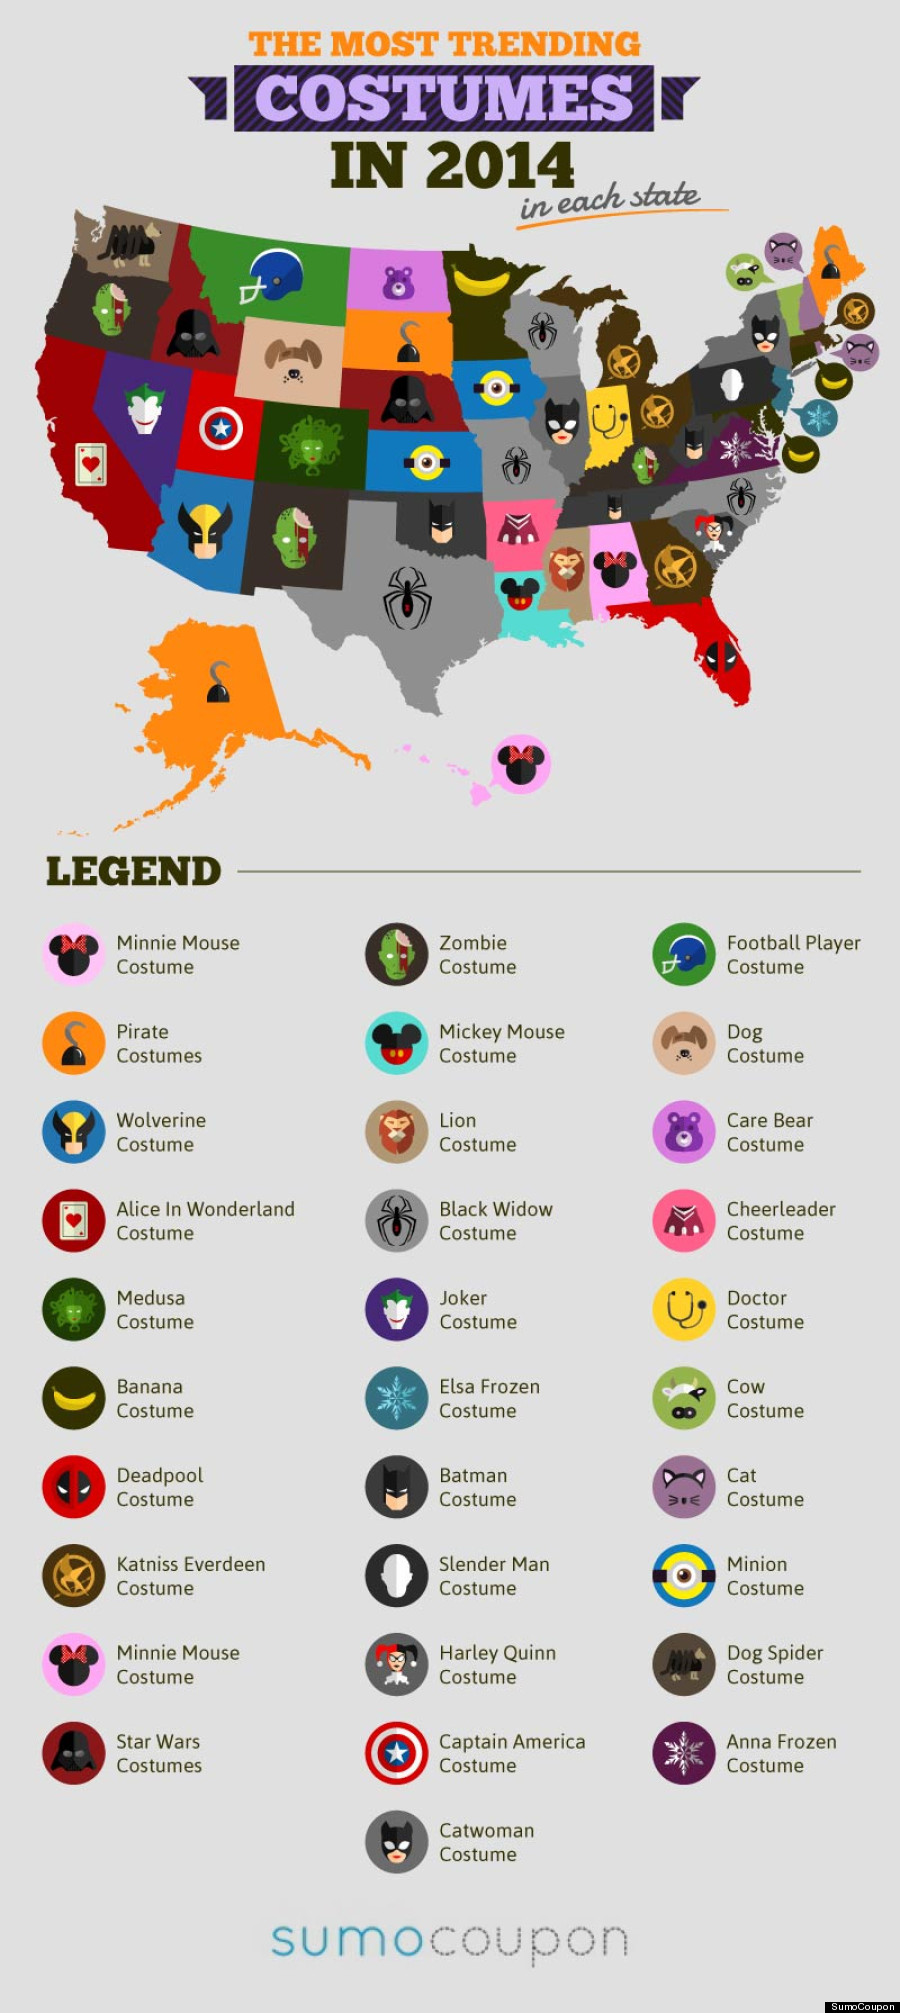
source: Huffington Post
Halloween spendings across the US

source: Halloween Spending Across America
The Best Cities for Trick-or-Treating
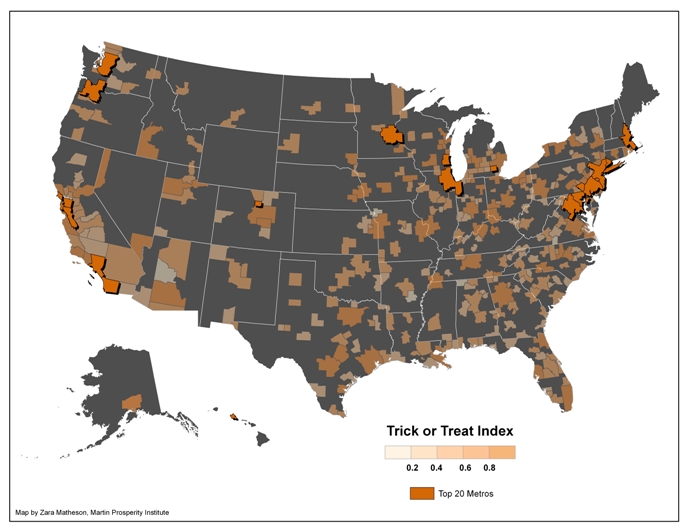
source: The Atlantic
Where horror films took place

source: Horror Freak News
[td_smart_list_end]