
SIASGE (Sistema Italo Argentino de Satélites para la Gestión de Emergencias) stands for Italian-Argentine Satellite System for Emergency Management. It represents a joint programme of the Italian Space Agency (Agenzia Spaziale Italiana – ASI) and the Argentine Space Agency (Comision Nacional de Actividades Espaciales – CONAE) with the scope to integrate the national radar missions of both countries and to cooperatively exploit the data. The mentioned national missions are the Italian COSMO-SkyMed and the Argentine SAOCOM missions. Both missions constitute SAR constellations with COSMO-SkyMed operating 4 satellites in X-band and SAOCOM with two satellites in L-band. The visionary idea of a joint mission already dates back to 20 years ago and was initiated by the former ASI President Sergio De Julio and the Director of CONAE Conrado Varotto. The synergy between the two constellations will create new applications based on the joint employment of the two radar technologies.
The satellites
COSMO-SkyMed constitutes an already established radar satellite constellation with four satellites orbiting in space since 2010. A second generation of satellites is planned to be launched in 2019/2020. The Argentine SAOCOM mission is a new constellation consisting of two satellites. SAOCOM-1A, the first of two identical satellites of the constellation, was launched on 8 October 2018 and finally reached its sun-synchroneous orbit at around 620km altitude. SAOCOM-1B, its twin satellite, is planned to join the same orbit in 2019. The Argentine company INVAP is the prime contractor for the design and construction of the SAOCOM-1 spacecrafts and their SAR payload. However, the satellites are developed in partnership with Belgium and Italy.
Apart from a thermal infrared camera, the SAOCOM-1A satellite carries an L-band polarimetric SAR instrument (~23cm wave length) with the objectives to:
- provide all weather, day/night polarimetric L-band SAR observations
- generate soil moisture maps particularly for the Argentine Pampas and lowland regions every 6 days covering an area of around 83 Mio hectars for giving support to agricultural and hydrological applications
- provide support to agricultural producers in the decision-making process related to planting, fertilization and irrigation, in crops such as soybean, corn, wheat and sunflower, for example, to optimize the use of fertilizers
- provide support to agricultural producers in relation to the use of agrochemicals (fumigation) for the control of diseases in crops, in particular for the fusariosis of the ear of wheat
- develop SAR interferometric techniques for collaborating with the development of different applications.
- collect data that is useful in emergencies, such as floods, droughts, desertification, landslides, oil slicks in land and ocean, fires, seismology, earthquake activity and volcanism
Depending on the swath and polarization mode the SAOCOM-1A satellite records with a horizontal resolution of 10 – 100m covering a swath width of 30km – 350km at an incident angle from 20 – 50° (for technical details consult https://directory.eoportal.org/web/eoportal/satellite-missions/s/saocom, ). Once the constellation is complete, SAOCOM will deliver 500 images daily orbiting the Earth 15 times a day.
The spacecraft operation is accomplished by the CONAE Control Center at Cordoba, Argentina with the support of ESA’s expert teams at ESOC in Darmstadt. All data processing, archiving and distribution is being provided by the MOC (Mission Operations Center) facility at Cordoba. The Cordoba (Argentina) and Matera ground station of ASI, Italy will be available for L-band SAR imagery downlinks.
Whats the advantage of SIASGE
The main difference between the SAECOM and COSMO-SkyMed missions is the wavelength of their sensors: The X-band of COSMO-SkyMed satellites has a wave length of around 3cm, while the L-band sensor of SAECOM satellites records at a wavelength of approximately 23cm. The different backscattering properties of the X-band and L-band translate into different kinds of information registered by the sensors. As a very general statement radar waves are backscattered by objects that have at least the size of their wavelength (and dielectric properties). – This can be explained by the wave and particle shape theory of electromagnetic waves. Hence, an X-band radar wave requires an object of around 3cm to be reflected, while an L-band wave is only reflected by objects larger than 23cm. As a consequence the X-band is useful to detect small objects, whereas the L-band is beneficial to observe larger objects that would result unclear at a smaller wave length. Combining the two facilitates to monitor geometric large objects at a great detail. The exploitation of both band characteristics is one of the striking advantages of the mission. A second benefit is the very good temporal resolution with two coverages per day.
SIASGE consists of six satellite, four of them from the Italian COSMO-SkyMed constellation and two of them from the Argentinian SAOCOM constellation. The image shows the satellites belonging to the joint mission. Source: CONAE
EXAMPLES
Following examples should highlight the different backscattering properties of the X-band and L-band and its impact on the various applications:
Trees: The X-band is reflected by leaves of ~3cm size while the L-band is reflected by the great structures of the tree such as branches or the trunk. Both bands can be exploited together to give a full representation of a forested area.
Agriculture: Consider rice plants growing in a paddy. The young plants emerging from the water will give a backscatter in X-band, while the L-band will not detect any signal and is much less effective at this stage of growth. If the plant reaches a major growing stage, the X-band will not alter considerably as it is saturated. In contrast the L-band changes during the vegetation period and gives useful information about the growing stage and the health condition of a plant.
Surface backscattering: Due to its small wavelength, the X-band is sensitive to small surface roughness. Hence, the x-band signal reflected at a rough surface comes from the surface itself. The same surface is seen much flatter by the L-band, because of the larger wavelength. L-band shows objects very clearly due to the double bouncing of the signal over smooth surfaces.
Penetration characteristics: The penetration of microwaves in terrain is directly dependent on wavelength. X-band is backscattered at the soil surface (if it is not very dry sand), while the L-band has more signal/sensitivity to the volume content of terrain as for instance soil moisture. Also dry sand and snow are penetrated to a greater extent by L-band than by X-band.
Interferometry: Phase measurements in X-band provide a much higher accuracy than in L-band due to the shorter phase cycle corresponding to half the wavelength. The comparison of phase measurements between two satellite passes is possible only if the two phase signals considered are correlated (coherent). Time decorrelation of phase signal is a strong limit to interferometric analysis and is much stronger in X-band than in L-Band. Hence, X- and L-band interferometric applications are complementary in terms of the area of application: L-band interferometry is more robust and of wider application while X-Band provides more accurate results over selected areas.
Backscattering properties of X-band and L-band on a surface covered by grass. Source: e-geos
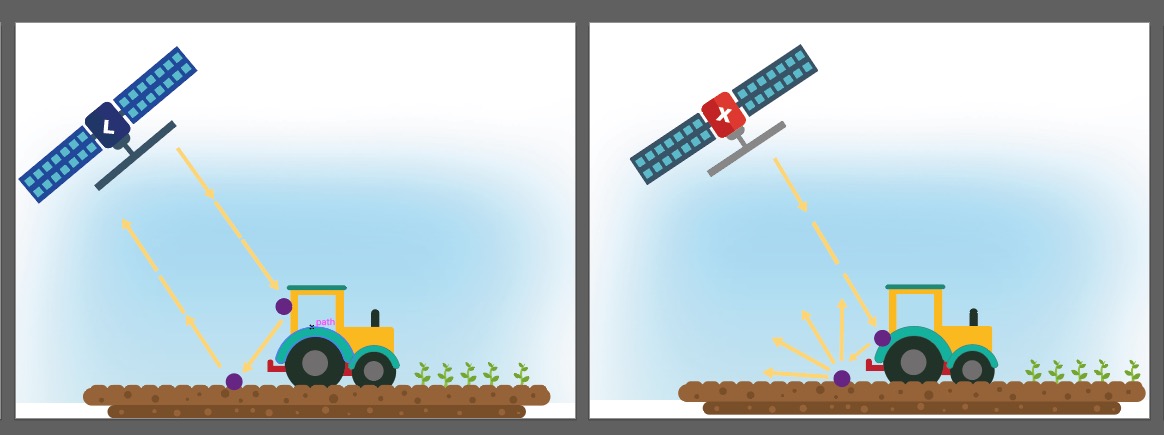
Backscattering properties of X-band and L-band on a farming machine showing double-bounce effects for both bands. Source: e-geos
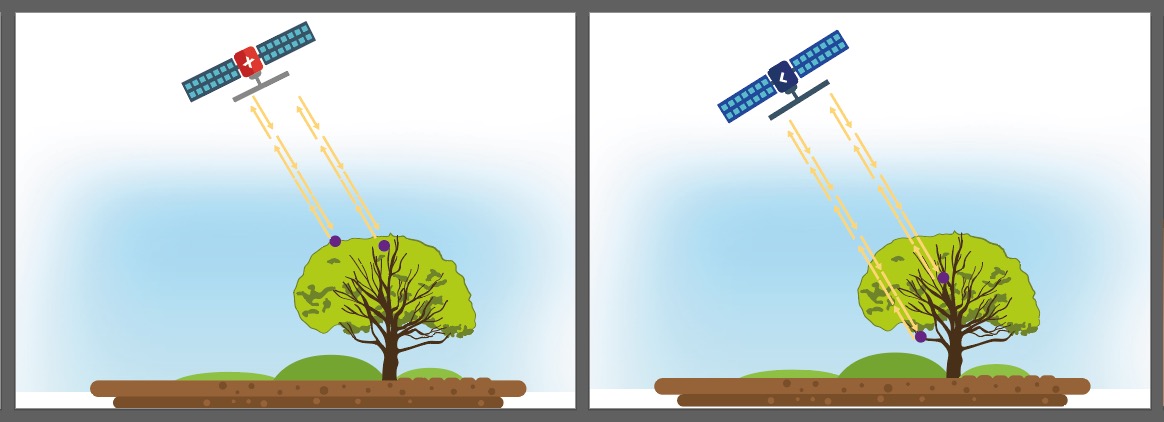
Backscattering properties of X-band and L-band at tree object. The double-bounce effect of L-band is shown in the right panel. Source: e-geos
Penetration characteristics of X-band and L-band into soil. Source: e-geos

#


Next article

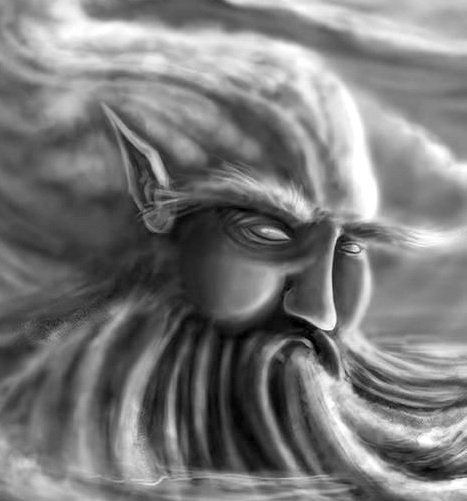
ESA’s new satellite was named after Greek mythology Aeolus. Image source: https://www.pinterest.ie/pin/515662226067007335/
At the end of August this year, European Space Agency was happy to announce the successful launch of their Aeolus satellite, creating an unprecedented possibility to measure wind speed around our planet. The story behind tremendous effort put into this mission by ESA and parties involved is as impressive as window of possibilities opened by the new sensor. The path leading to placing this satellite in orbit was paved with obstacles that required to go beyond the state-of-the-art numerous times. This mission is a perfect example of why space industry is at the forefront of the race to improve our everyday life through pushing the boundaries of what’s possible.
Earth Explorers
Aeolus — named after Greeks mythology keeper of winds — is fourth launched satellite from ESA’s own Earth Explorers mission. The idea behind EE program was to focus on a number of Earth’s spheres including also Earth’s interior. Previously launched satellites are:
- SMOS(Soil Moisture and Ocean Salinity), launched on 2nd of November 2009 to measure the moisture held in soil and salinity in the surface layers of the oceans
- GOCE(Gravity field and steady-state Ocean Circulation Explorer), launched on 17th of March 2009 to provide high spatial resolution gravity-gradient data improving global and regional models of Earth’s gravity field and geoid
- CryoSat, launched on 8th April 2010 to measure fluctuations in ice thickness
On 22nd of August 2018 Aeolus became the fourth Earth Explorer and first in 8 years launched for this programme. Back in 2002 however, Aeolus was meant to be the second.
Let’s measure the wind
The mission was planned before the beginning of the 21st century, initially as Atmospheric Dynamics Mission, with main goals of better understanding phenomenas such as El Niño and Southern Oscillation. The sensor however was promising much more, allowing to understand in a more complete manner, the behaviour of our atmosphere. Putting it simple, data provided by this satellite can potentially result in better weather forecast prediction, air pollution monitoring, global warming analysis and more.
The study of mission’s feasibility was completed at the end of 1999 which lead to development and design stage in 2002. From that point the potential launch date was estimated to be October 2007 and on 22nd of October 2003 ESA has signed a contract with EADS Astrium UK to develop Aeolus. The initial estimate turned out to be undershot by almost 11 years…
Tough blows for wind satellite

ALADIN(Atmospheric Laser Doppler Instrument). Image source: link
The crucial component of the satellite was naturally it’s sensor — ALADIN(Atmospheric Laser Doppler Instrument). Initial tests for thermal and structure resistance to space conditions began in 2005 and were successful which lead to beginning of development of sensor’s hardware. By the end of 2005, ALADIN’s prototype emitted its first UV light pulses however the launch date was for the first time pushed back a year, to 2008.
The troublemaker
ALADIN’s measurement of wind is based on doppler effect similar to e.g. SAR sensor but using laser-emitted UV light instead of radio waves.
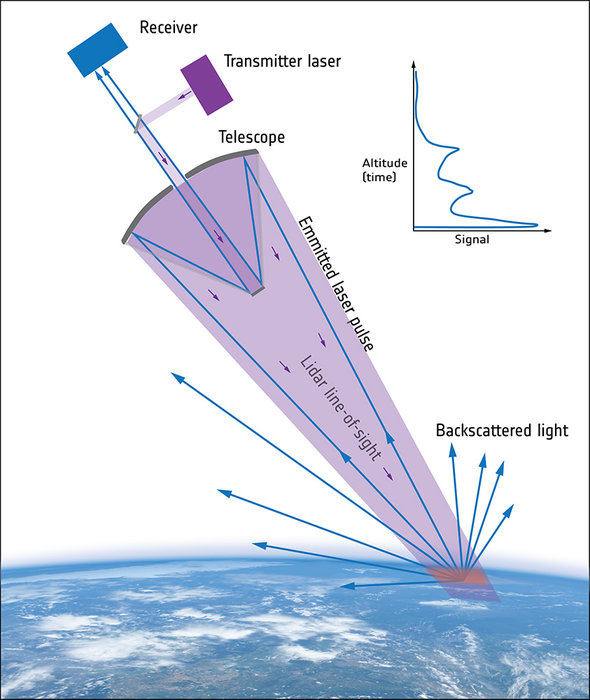
ALADIN’s lidar concept. Image source: link
Unfortunately measuring scattered particles is a bit trickier than solid objects and so was the development of the sensor. One of the basic requirements for the laser in the sensor was initially to emit 100 light pulses per second over operational period of the satellite which is usually couple of years. You can ask Google
seconds in year times hundred
and it will give you an answer of approximately 3.15 * 10⁷ pulses per year. Adding couple more requirements like high pointing stability, ability to survive the launch, remote control and monitoring capabilities made the development even more difficult. Oh, and you remember that it had to do it all in not very welcoming space environment right? Optical components are not big fans of vacuum conditions.
As later in 2013 ESA’s ALADIN instrument manager, Denny Wernham would say:
“This issue was tackled on multiple fronts: new UV coatings were developed, the energy density of the laser in the UV section was reduced while keeping the total output energy constant by improving the efficiency of the crystals that convert infrared to UV light, and it was decided that the new UV optics would be ‘screened’ to guarantee their performance.
Manufacturing was certainly a huge challenge but not the only one. Once the sensor was rough and ready it had to be thoroughly tested.”
Heavy light test
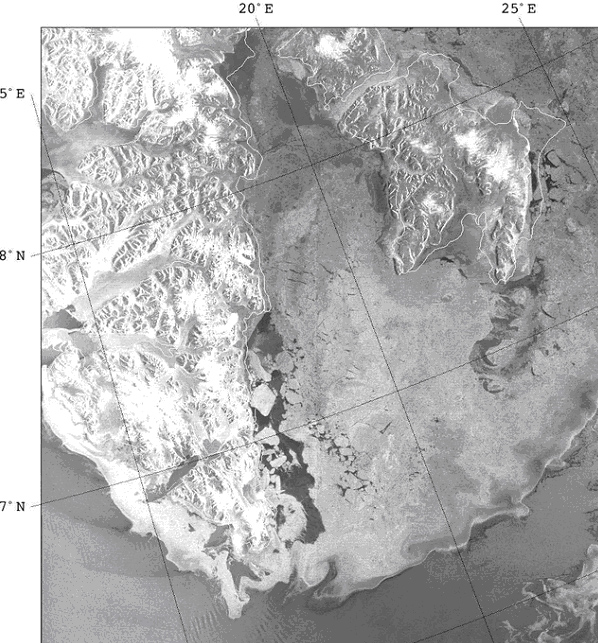
To test the concept of the sensor in the real world before going beyond atmosphere, Aeolus team first developed ALADIN Airborne Demonstrator(A2D) that could be attached to an airplane for test flights. A2D was built to collect data in pre-launch campaigns. The data had to be analysed and validated against ground station measurements which would also allow for better sensor calibration. Test campaigns were performed in such extreme locations as Schneefernerhaus observatory situated 2650 meters above sea level and over Greenland and Iceland territories near the Arctic Circle.
Moving to 2010, the experiments allowed to improve mathematical model used for interpreting measurements from LIDAR. Initial model, created in early 1970s was updated allowing to describe shape of backscattered light up to accuracy of 98% which translates into improved accuracy of measurement of molecules speed in the atmosphere — the main purpose of ALADIN. The improvement not only allowed to better Aeolus sensor but also improve state-of-the-art for other lidar sensors using this model.
Light in the tunnel
After over 5 years of testing, improving and pushing the boundary of what’s possible, the development of the sensor destined for orbit could progress. In April 2013 ESA announced successful test where the sensor was turned on for 3 consecutive weeks emitting some 90 million laser shots which brightened the future of the mission. The launch was expected to happen in 2015. Additional test for ALADIN and the development added couple more to already long journey. On 7th of September 2016 ESA secured the launch with Arianspace and ESA’s Director of Earth Observation Programmes Josef Aschbacher summarised:
Aeolus has certainly had its fair share of problems. However, with the main technical hurdles resolved and the launch contract now in place, we can look forward to it lifting off on a Vega rocket from French Guiana, which we envisage happening by the end of 2017
It actually took a year longer but on 22nd of August, 2018, after so many years of developing the technology that was never developed before…
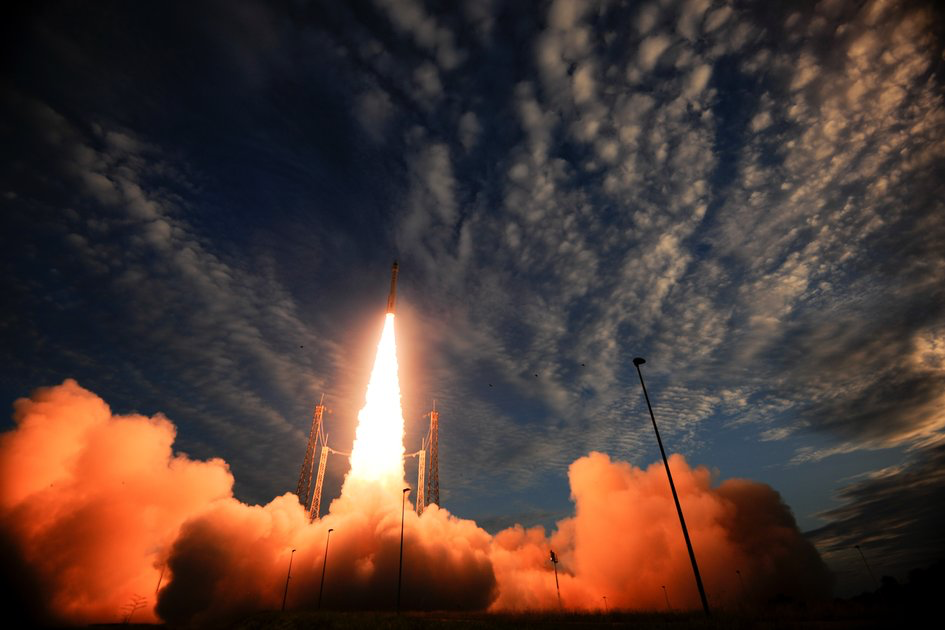
Aeolus launch fromEurope’s Spaceport in Kourou, French Guiana. Image source: link
The future
The Earth Explorers mission continues with three new explorers announced last week by ESA. Looking at an amazing history of Aeolus we may doubt the timeliness but we can be sure about successful delivery.
References: ESA
Appendix—first results already available!