SAR-Synthetic Aperture Radar
I just came back from a summer school in Germany and wanted to share with you the topic that accompanied me during this week. Radar remote sensing still belongs to one of the less discussed issues in the geospatial domain. The reasons therefore are diverse. The radar based technique implies not only a highly specialised form of remote sensing application but also sound knowledge about the physics and processing behind. Thus, it is often associated with discomfort in the geospatial community, while for a broad majority it is still an unknown issue. Indeed, radar remote sensing is something very ‘technical’ meaning that it does not need a natural source of radiation and runs completely man made working with an active and passive mode of sending and receiving exactly one wave length (in the microwave spectrum). The technology completely relies on the physics of electromagnetic waves, which is a huge advantage of radar: We are talking about exact measurements when the backscattered wave is compared to the sent one concerning its physics and the time response and thus have exact results.
Meaningful for the reflection of radar waves on the surface are the presence of (liquid) water (di-electric objects), the size of an object and the roughness of the surface. The system itself always emits the radar wave on one side. These characteristics explain the backscattering behaviour of the waves that finally makes up a radar image. To describe some scenarios, flat water reflects the radar waves into outer space according to the arrival angle (mirror effect), whereas the front side of ocean waves will return the radar waves back to the sensor. Ice (crystalline water) is penetrated as any other solid object lacking water, which explains the use of radar satellites for assessing the ice masses of the poles. The penetration properties of vegetation depend on the kind of green structures and the wavelength. The rule here is that only objects of at least the same size as the radar wave length may facilitate reflection. Accordingly, small vegetation structures such as crops or meadows reflect small wavelengths (X-band) and are permeable for long ones (L-band), while forests reflect small wave lengths, though not always on the canopy surface, and long wave lengths are only backscattered by stems and big trunk structures.
Applications in science and engineering
The characteristics of radar make the technology useable for a vast range of applications in the civilian sector (see points below). Due to its sensitivity to water and artificial objects as well as the independency from sun radiation (possibility to also scan by night) radar is also used for military purposes.
- Sea ice monitoring
- Glacier monitoring
- Snow features
- Water bodies, floodings
- Ocean wave spectra
- Soil Moisture
- Topography – the SRTM is based on radar information
- Surface deformation detection (interferometry- InSAR)
- Crop production forecasting
- Forest cover mapping
- Coastal surveillance (erosion)
- Monitoring disasters such as forest fires, floods, volcanic eruptions, and oil spills
- Urban planning
Some examples to demonstrate the specificities of radar remote sensing.
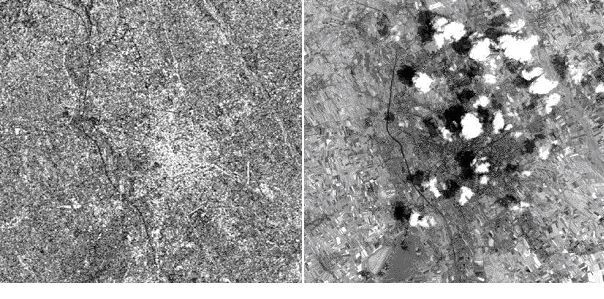
These images were acquired over the city of Udine (I), by ERS-1 on the 4th of July 1993 at 9.59 a.m. (GMT, left) and Landsat-5 on the same date at 9.14 a.m. (GMT, right) respectively. The clouds that are clearly visible in the optical image, are not appearing in the SAR image. Source: ESA/Envisat via SAR Summer School.
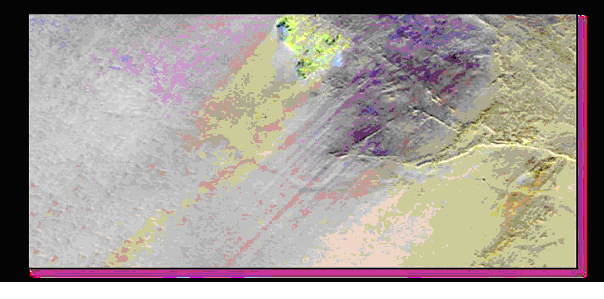
Subsurface penetration of radar waves at Safsaf oasis in agypt: In the upper panel LANDSAT thematic mapper shows the sandy surface of the desert, while the SIR-C radar image at the bottom reveals subsurface structures created by water run-off. Source: SAR Summer School.
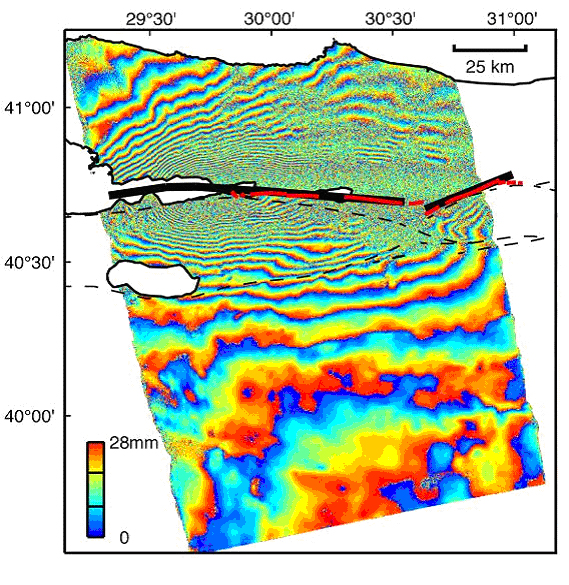
Interferogram (2 radar images) produced using ERS-2data from 13 August and 17 September 1999, spanning the 17 August Izmit (Turkey) earthquake. (NASA/JPL-Caltech). The image shows deformations after the earthquake. Source: ESA.
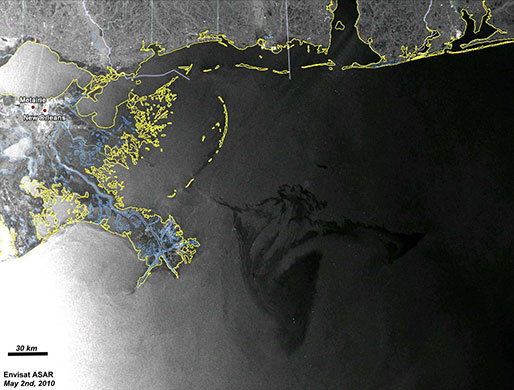
In this radar image, acquired from Advanced Synthetic Aperture Radar (ASAR) on 2 May 2010 03:45 UTC (Saturday night local time), the oil spill is visible due east of the Delta National Wildlife Refuge extending into the Gulf of Mexico. The white dots are oil rigs and ships. Radar is especially suited for detecting oil spills because it works day and night, can see through clouds (unlike optical sensors) and is particularly sensitive to the smoother water surface caused by the oil. Source: Envisat/ESA via The Guardian.
After four days of education I was impressed by the range of possibilities in radar remote sensing. During the week I found out that radar technique indeed is a complex application, though learnable and for the usage you dont’t have to be an electrical engineer/physicist as it is sufficient to get into the mathematical and physical basics step by step. Radar is still a young technique and a lot of research is done to improve application and sensor technique. Hence, it is going to offer a lot of opportunities of research and finally employment in the future.
The SAR Summer School was organised by University of Jena and German Aerospace Centre (DLR). This year it was held the first time. For those interested to attend the course next year, click here.
SOME TECHNICAL ADDITIONS
SAR – Synthetic Aperture Radar refers to the fact that one point is captured several times separately. This enhances the spatial resolution in azimuth direction (flying direction of the satellite) compared to a real aperture radar.
Most used wavelengths
Band wavelenght
X 2,8-5,2cm
C 4,8-7,7cm
L 19-77cm
Finally some polar orbiting missions:
Past missions
First sensor SeaSAT (1976)
ESA Ers-1 and Ers-2 (1991–2000, 1995 – 2011), Envisat/ASAR (2002-2012)
Japan Jers-1 (1992-1998), Alos/PALSAR (2006-2011),
Actual radar missions
Germany TerraSAR-X, TanDEM-X (2010, WorldDEM – Astrium)
Italy COSMO Sky-Med (2007)
Canada RadarSAT 1 and RadarSAT 2 (1995-2013? and 2007)
India RISAT-1 (2012)
Future missions
ESA Sentinel 1 (2014)
Japan Alos 2 (2013)

#


Next article
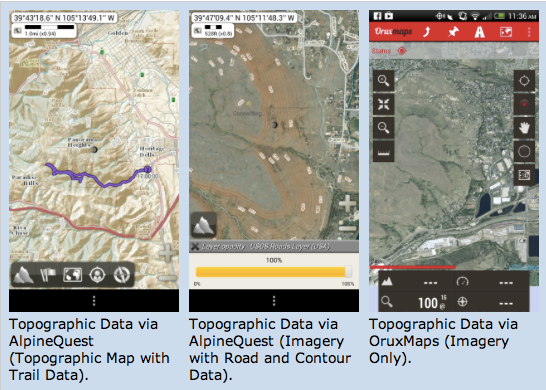
U.S. Geological Survey (USGS) released its topographic maps and data for the use on mobile devices. USGS is one of the major scientific organisations in the US providing information on the processes of the physical environment such as ecosystem, climate and land use change, water, energy and minerals or natural hazards. As such it stores a huge collection of satellite and aerial images from MODIS, ASTER, AVHRR and LANDSAT sensors/satellite to mention some examples. The National Map topographic maps and data of USGS are now available on both Android and iOS mobile devices. The released information comprises the afore-mentioned imagery as well as topographic maps such as road or contour layers distributed by USGS that for instance can be laid over the images. The application proofs to be useful in combination with GPS, when the geographic information of the exact position can be retrieved (and zoomed into maps) while being outside hiking, biking, running, etc. The National Map runs on two Android apps, OruxMaps and AlpineQuest, as well as the Galileo Offline Maps iOS app on iPhone (available at Apple Store). The Mobile Atlas Creator (MOBAC) enables the retrieval of topographic data even when cell coverage is not available and has to be done before going somewhere without data connectivity.
Please, find the installation guide for Android, iOS devices and MOBAC here (source).