
Referring to my last article about radar remote sensing I decided to continue with the topic and from time to time will focus my writings on information and latest happenings in this subject. As a European, today I want to concentrate on European activities towards SAR. Recently, there was a lot to hear about Sentinel-1, ESA’s earth observation satellite that is going to be launched in spring 2014. Beside an optical sensor Sentinel-1 is going to be equipped also by SAR, which is less known and is the topic of this article.
With the missions ERS-1, ERS-2 and ENVISAT, ESA produced a continuous time series of radar images for 20 years. The ERS-1/ ERS-2 constellation (same orbital parameters) delivered radar images that are interferometrically compatible. Since the cease of ERS-2 in 2011 and the failure of ENVISAT in 2012 the provision of radar information has been suspended resulting in a monitoring gap, which is disadvantageous for long term studies. Sentinel-1 is planned to pursue ESA’s radar initiative by next year, whereas a second radar sensor will be launched one year later. The Sentinel radar mission is part of the European Radar Observatory, a polar orbiting satellite system for the continuation of SAR operational applications. It was set up in the frame of GMES (Global Monitoring for Environment and Security, now known as Copernicus) that is the joint initiative of the European Commission and the European Space Agency, designed to support Europe’s goals regarding sustainable development and global governance of the environment by providing timely and quality data, information, services and knowledge. GMES services so far rely on the availability of radar and optical imagery of ENVISAT, ERS, Radarsat, SPOT and Landsat. The proposed Sentinels provide the necessary continuity of measurements. Like the previous missions of ESA, Sentinel is going to continue with C-band (roughly around 5cm wave length) and is envisaged as a two satellite system operated as a constellation for maximized coverage/repeat cycle aiming a temporal resolution of 3 days. The corresponding wavelength has been found useful in sea ice surveillance, one of the major points in GMES. Imaging radars equipped by C-band are generally not hindered by atmospheric effects and are capable of ‘seeing’ through tropical clouds and rain showers. – In contrast, X-band is reflected by heavy precipitations clouds and therefore used for detecting those. Its penetration capability with regard to vegetation canopies or soils is limited and is restricted to the top layers. Sentinel-1 radar sensor will have an interferometric wide swath (wide scan stripe of 250km and a ground resolution of 5x20m) and wave mode, a rapid data dissemination and data provision within an hour of acquisition.
With those features Sentinel-1 meets the user requirements of GMES. The radar imagery is going to be useful for following purposes that are similar to those described in my forst article about radar remote sensing:
OBJECTIVES
Monitoring European marine environment (North Atlantic, Arctic Sea)
- Daily surveillance of marine transport corridors to detect illegal discharges and gather prosecution evidence
- oil spill detection especially in North Atlantic waters
- Monitoring activities by flag state vessels in third party waters, monitor major shipping routes to detect illegal activities on a regular basis with daily coverage of the European Economic Zone.
Monitoring the arctic environment and sea-ice zones
- Daily monitoring of ice-infested areas along the major transport routes.
- Sea ice and iceberg monitoring
- Arctic habitat and glacier monitoring
Monitoring and assessing land surface-motion risks
- 2-Weekly measurements of subsidence over all major urban areas;
- Regular surveillance of transport infrastructure (every two weeks in the case of gas pipelines).
Open Ocean Surveillance
- Oil Spills
- Wave information
Forest monitoring
- Forest Monitoring for Climatic Change
- Forest Monitoring Inputs for National Greenhouse Gas (GHG) Reporting
- Forest Monitoring Inputs for CDM Projects
- Forest Monitoring for Sustainable Forest Management
- Clear Cut Mapping and Monitoring Service
- Sub-National Forest Information Update
- Forest Monitoring for Environmental Issues and Nature Protection
- Land Cover and Forest Indicator Service
Water management and soil protection
Forest fire and flood management
Crop monitoring
Application examples
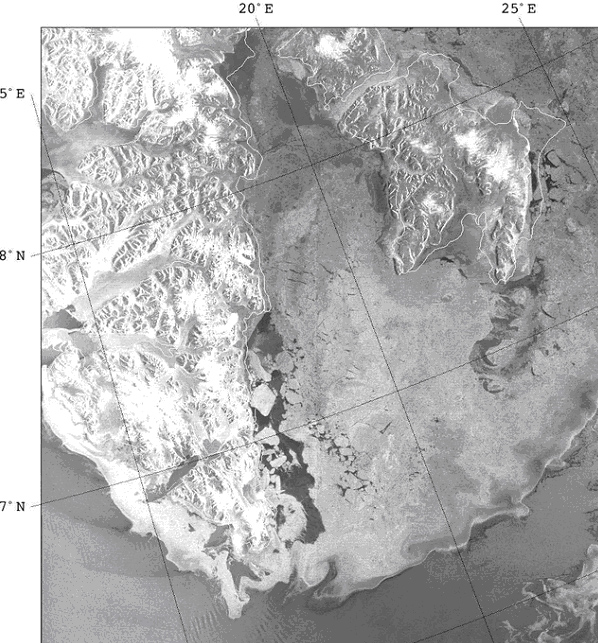
ASAR (ENVISAT) C-band Image near Svalbard (4 April 2004). Source: ESA.
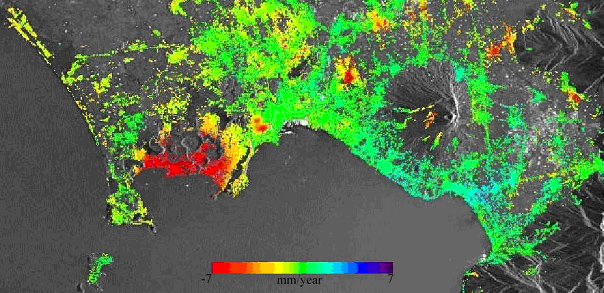
False-colour map of the measured deformation superimposed on the SAR image amplitude of Napoli Bay (Italy). The red coloured plots at the Western edge of the bay are located around the city of Pozzuoli, which is known for the ‘bradisismo’, an Italian word referring to sinking or lifting ground motion and a phenomenon that is known since the Roman tmes 2000 years ago. Source: ESA.
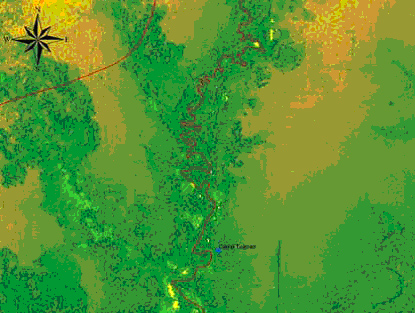
Forest Monitoring Concept and example of ASAR-based Change Detection for Fast Response to Illegal Logging in C-band (suspect spots in yellow). Source: ESA.
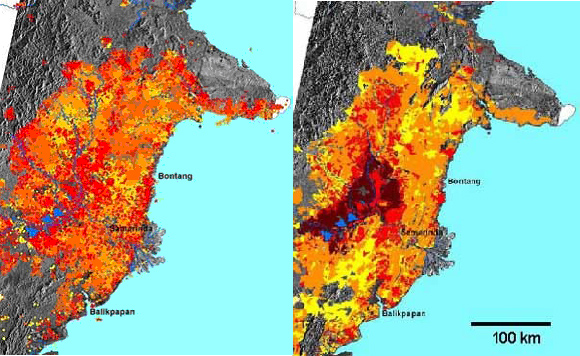
Forest Fire Damage Assessment derived from ERS C-Band Multi-Temporal
Interferometric SAR (left) and NOAA AVHRR hot spots (right). Source: ESA.
Source: ESA, Sentinel-1 radar mission

#

Next article
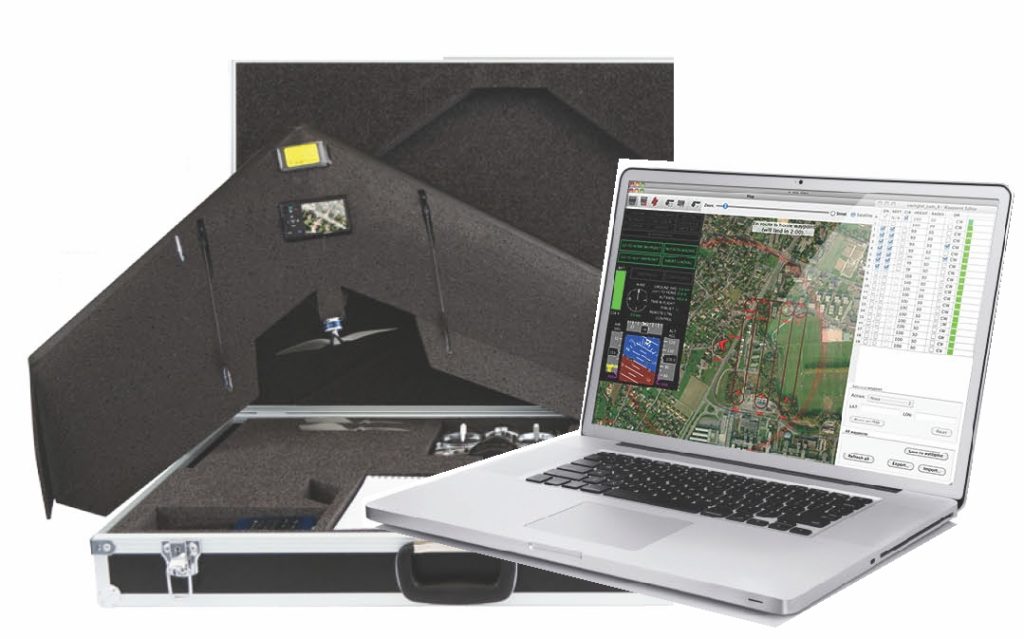

 Unmanned Aerial Vehicles have a special place in my list of awesome stuff in the world. The long hours in the hot Indian sun, trying to get the total station to work and take measurements is certainly something that I did not enjoy as a geomatics student in India. A couple of years later, as a GNSS engineer I saw the most awesome gadget in geomatics – the UAV that can replace all the hard work in the field for the surveyor. You have to agree that a small glider that can help prepare maps with few cm resolution, whenever you want and at a fraction of the cost of a real photogrammetry mission is certainly awesome.
The UAVs have been revolutionizing the world of photogrammetry and surveying in an unprecedented fashion. UAVs have allowed surveyors to complete surveys in less than few hours which traditionally would have taken somewhere around a few days. They made surveying possible in terrains that were hostile – forests, mountains, etc.
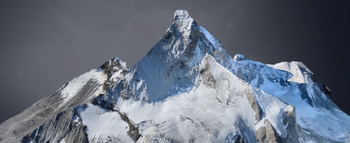 If Google Earth Street View made it possible to take a virtual tour of the most famous cities in the world, UAVs are going to change the way we looked at mountains 😉 Mapping the mountains to be GEOMATICALLY correct! SenseFly, a Swiss company has completed a historic mission by mapping the most famous mountain in the Alps – “The Matterhorn”.
I’ll let you witness the awesomeness before I go on raving about the achievement 😉 Oh and by the way, the 3D model has a resolution of 20 cms!!
Just a bit of trivia: In May 2011 researchers from the DLR (Deutsche Zentrum für Luft- und Raumfahrt) created a 3D model of the Matterhorn with a maximum resolution of 50 cm using optical satellite data, in cooperation with DigitalGlobe and 3D Reality Maps.The fact that is now possible to produce 2D and 3D models with a resolution of 20 cms even in the most daunting of terrains using the UAV technology makes this flight by the SenseFly team a historic event.
UAV in mapping = awesomeness 🙂
So what you think? Is the future of mapping headed the UAV way or what? Let us know!
Source: Direction Magazine