
On a cold January night in 2015, Philadelphia’s then-Mayor Michael Nutter signed two disaster proclamations in anticipation of a “crippling and potentially historic” blizzard. The neighboring New Jersey also issued a state of emergency, canceling schools, ordering all non-emergency vehicles off the roads, and warning residents of possible power outages.
The next day, the storm came. But it wasn’t in the form of heavy snowfall; it was in the fashion of a flurry of apologies by embarrassed meteorologists for their “big forecast miss”. The ‘Blizzard of the Year’ had become the ‘Bust of the Year’.
Many were reminded of BBC Weather forecaster Michael Fish who had chimed during an October 1987 broadcast: “Earlier on today, apparently, a woman rang the BBC and said she heard there was a hurricane on the way… well, if you’re watching, don’t worry, there isn’t!” That evening, the most devastating storm in nearly 300 years hit South East England.
These weather guys are so wildly wrong every so often, meteorology has unfailingly been on the receiving end of jokes and criticism. Well, essentially, the accuracy of forecasts is directly proportional to how many eyes we have in the skies gathering varied weather observations like temperature, wind speed, moisture, etc. These data are then fed into mathematical models that tell us how the weather is going to behave over the next three to seven days.
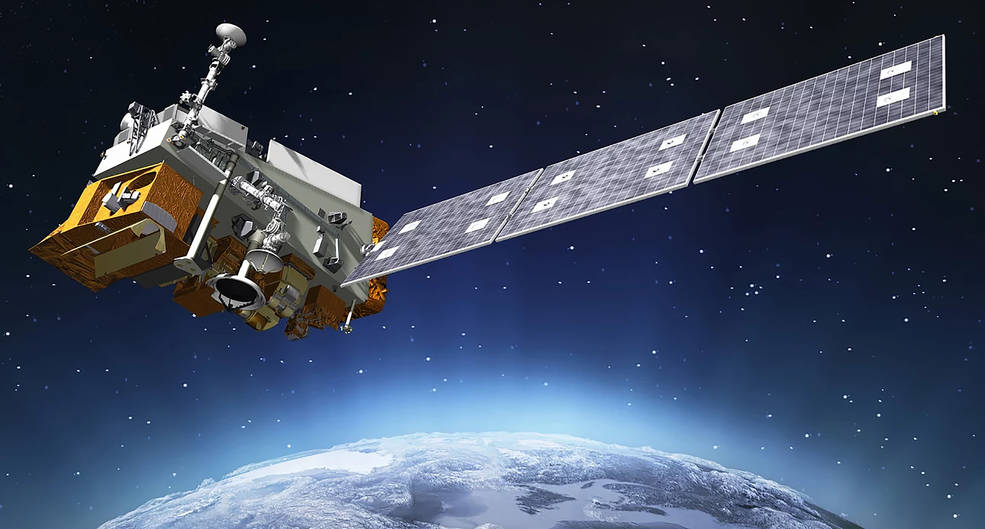
So, if we make our input data better, the forecasts should also become more accurate, right? Well, that is exactly what NASA and NOAA’s Joint Polar Satellite System (JPSS-1) intends to do. Launched earlier this month, JPSS-1 boasts of “the latest and best technology that NOAA has ever flown operationally in the polar orbit to capture more precise observations of the Earth’s atmosphere, land, and water.” The satellite was rechristened as NOAA-20 on reaching its final orbit.
Circling the Earth from pole to pole 512 miles above the surface, 14 times a day, JPSS-1 will capture the weather as it unfolds across every single spot on the planet at least twice every 24 hours. This is what differentiates JPSS-1 from GOES-16 – another bird that made headlines this time last year for being the most-advanced weather monitoring satellite out there. While GOES-16 will remain fixed over the American region throughout its lifecycle, JPSS-1 will provide free and open global data to organizations like EUMETSAT, the United Kingdom Meteorology Office, the Australian Bureau of Meteorology, the Japan Meteorological Agency, the Korean Meteorological Agency, Environmental Canada, World Meteorological Organization, and more.
The polar satellite is modeled with five super-sensitive instruments:
Advanced Technology Microwave Sounder (ATMS): Provides microwave measurements of Earth’s temperature and moisture
Clouds and the Earth’s Radiant Energy System (CERES): Measures solar-reflected and Earth-emitted radiation
Cross-track Infrared Sounder (CrIS): Produces detailed 3D temperature, moisture, and pressure profiles
Ozone Mapping and Profiler Suite (OMPS): Monitors ozone levels in the stratosphere
Visible Infrared Imaging Radiometer Suite (VIIRS): Captures high-resolution images and data in visible and infrared light
“These instruments are so precise, they have temperature sensitivity better than one-tenth a degree,” explains Dr. Mitch Goldberg, Chief Program Scientist, NOAA-JPSS. ATMS can see temperature and water vapor even through clouds. The vertical resolution of CrIS has been upgraded by a factor of more than six, so it gives us six times more information than its previous avatars. At 3,000-kilometer swath and a 375-meter resolution, VIIRS has the highest resolution out there with respect to how much coverage it has. OMPS is a critical source of data that goes into UV forecasting, and CERES is essential for Earth radiation budget studies.
All these instruments work in tandem to give data-hungry meteorological models the inputs they need very, very quickly (Fun fact: About 85 percent of all data that’s used in numerical weather prediction models come from polar-orbiting satellites)
“VIIRS, for example, has very good sensitivity to fires,” tells Dr. Goldberg. It can detect the location and temperature of even very small fires, and that information can be used to predict smoke plumes. “While VIIRS is being used to forecast smoke plumes, at the same time, CrIS will measure the carbon monoxide and methane that’s emitted from that fire. So, it allows us to see an integrated view of how fires can impact air quality.”
While all the instruments aboard JPSS-1 are extremely powerful, VIIRS is actually something of a superstar. It has already proved instrumental in tracking the widespread flooding caused by Harvey and Irma. NOAA has also been sending the images captured by VIIRS to FEMA and other emergency managers to help them track the power recovery in Puerto Rico. The instrument can also be used for monitoring volcanic plumes and eruptions or even keeping an eye on global vegetation health. “We can see droughts not only in California, but across all corners of the globe. It’s really important for food security,” insists Dr. Goldberg.
For Joe Pica, Director, Office of Observations, NOAA National Weather Service, polar satellites like JPSS-1 are the backbone of Global Observing System. “Satellite observations not only help us monitor and collect information about current weather systems, but they feed the models that allow us to predict the weather today, tomorrow, the weekend, and next week. This was never more apparent than this last hurricane season. From Hurricane Harvey to Maria, we provided emergency managers with the knowledge they needed to make life-saving decisions well in advance: Order effective evacuations, pre-position response assets, and prepare the public to take action well before the storm got there.”
JPSS-1 is only the first in the series of four highly-advanced NOAA operational polar weather satellites. The mission is designed to ensure the continuity of key observations of weather forecasting for the next 20 years and beyond. As Lars Peter Riishojgaard, Director, Observing and Information Systems, WMO, points out, “You want a system that is able to deliver data 365 days a year, 24 hours a day, also at 3:00 a.m. on a Sunday morning, and also when everybody is sitting down for their Thanksgiving dinner and your staffing levels may be at a minimum. And JPSS-1 is built that way.”
If you enjoyed this article, read more and subscribe to our monthly newsletter!

#


Next article
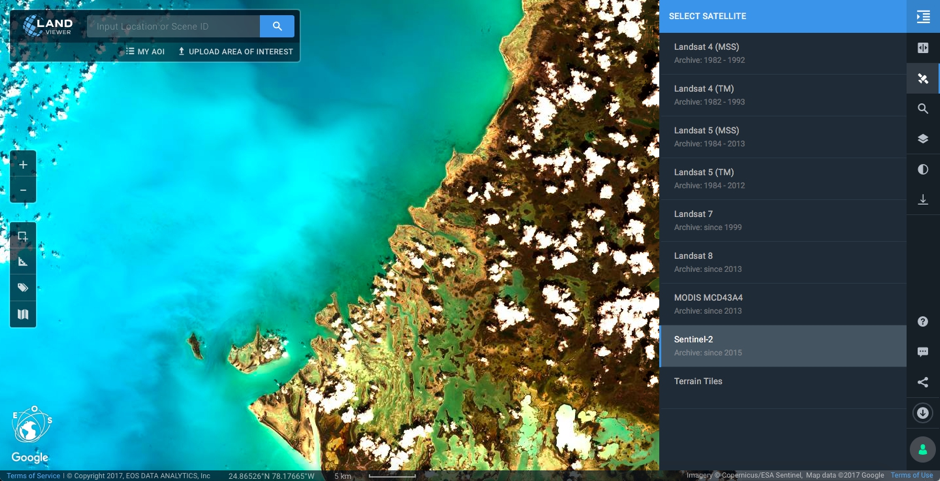
LandViewer is a powerful satellite data processing and analytics platforms. It allows you to select a geographic area for analysis, choose various types of remote sensing data and do all sorts of analytics on-the-fly, which may improve working with satellite imagery.
I reviewed LandViewer a few months ago, and it was very impressive. With the latest update, it got even better. Besides initially available Landsat 8 and Sentinel 2 you can now access the huge data archives of Landsat 4, Landsat 5, Landsat 7 and MODIS, including coverage of the entire surface of the Earth and daily updates.
For those who decided to use LandViewer for the first time, developers have added a useful step-by-step interactive guide which you can access by clicking on the button with a question mark in the lower right corner of the screen.
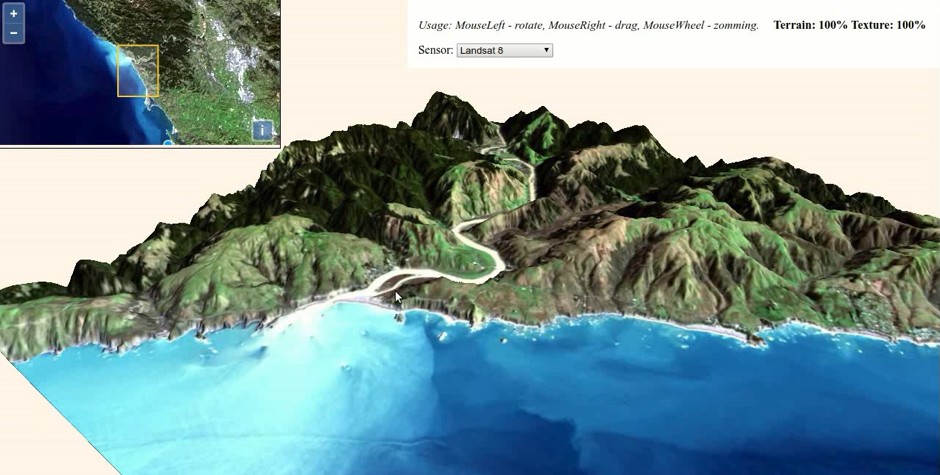
One of the coolest new features is a 3D viewer, that allows you to build a three dimensional model of the Earth’s surface on-the-fly. To build the model LandViewer uses a basemap elevation coverage data, taken from the Amazon open public database. The texture is automatically superimposed on the model from Sentinel-2 and Landsat 8 satellite images. The tool is based on three.js library that allows to zoom, rotate and move the model along any axis, among other cool features.
The platform gives the opportunity to simplify the work and calculate spectral indices for different dates. You can now receive information from remote sensing data directly in the browser with no need to download huge amounts of satellite imagery.
Moreover, working with defined Area of Interest has become much more convenient. Previously, when loading your GeoJSON or KML file in LandViewer only a single area could be impoerted. Now it is possible to upload multiple polygons, lines or points from external files that can make your life much simpler.
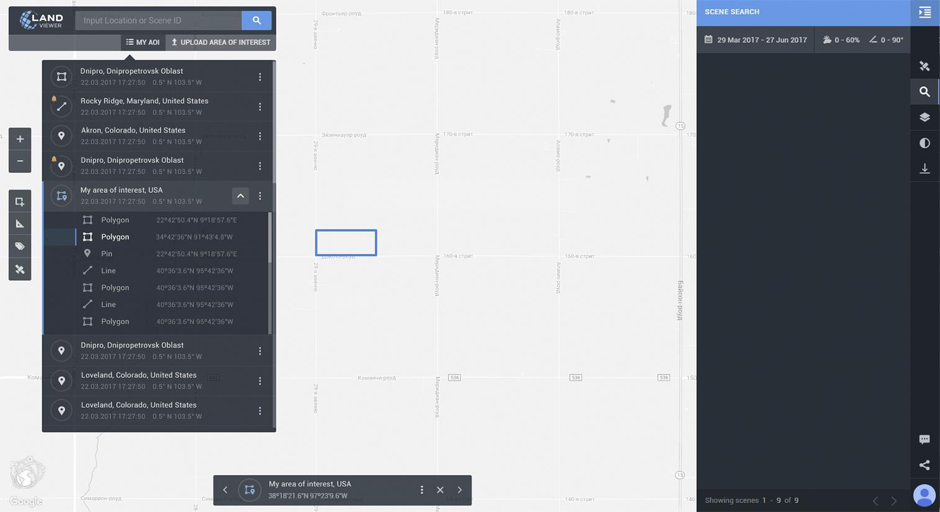
In addition, you can now draw the AOI directly in LandViewer, save it to the lists and download created AOIs to your computer. The turning on the notification function and receiving the email notifications of new images with a preview and characteristics is also available for AOI.
The LandViewer analysis is also much easier to integrate with your other software. Using the standard protocol for maps serving, Web Map Service (WMS), you can now browse the imagery from LandViewer directly in your desktop or online software applications like Qgis, ArcGIS, etc.
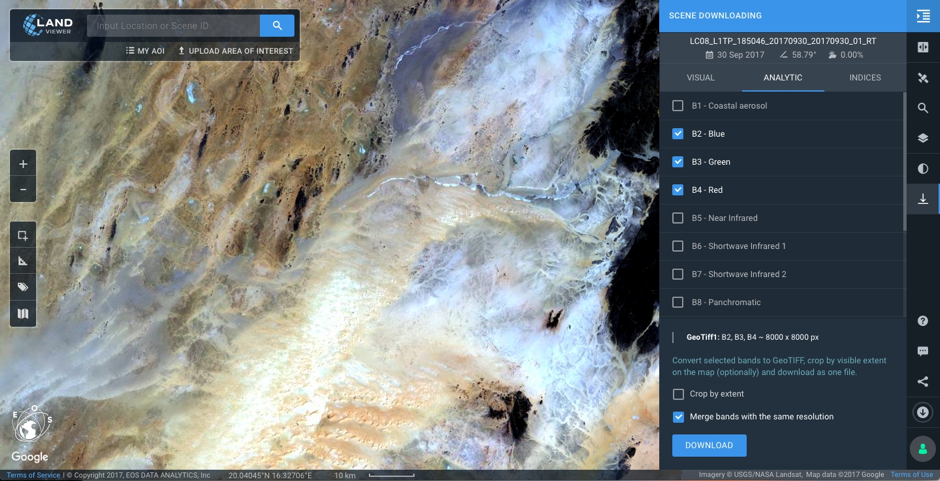
Moreover, new features for data download were added. Now the image visible in LandViewer can be downloaded in any band combination and with any contrast settings as JPEG for the web or print. There is no need to download the whole image if you are only interested in a specific part of it. Cool! Downloading bands can be done either individually or as a single file in GeoTIFF format. It also became possible to load pre-calculated spectral indices in GeoTIFF.
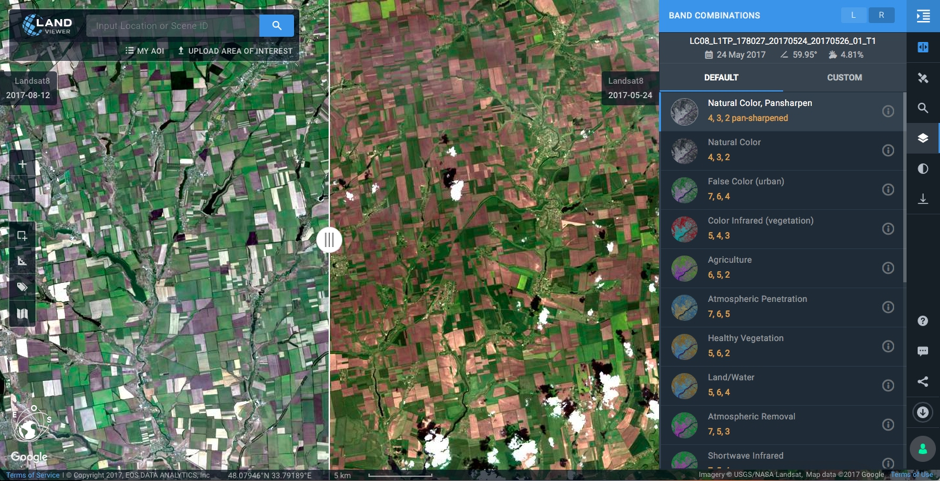
One more interesting solution is the new viewing functionality that allows to open two images and provides the convenience of comparing pictures with the slider that split the screen into two parts. User can choose to compare images with any band combinations (even created by his own) or spectral indices. It is possible to compare images not only from one satellite but from different ones.
Great job LandViewer team!