
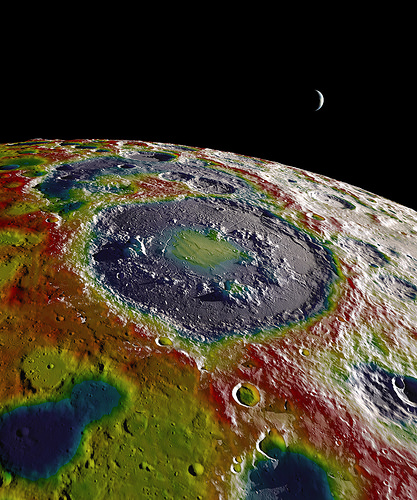
Image by NASA Goddard Space Flight Center
The power of geographic information systems (GIS) is undisputed in every field it has been applied to. From climatologists using the software to determine the impacts of climate change to epidemiologists tracking the spread of disease outbreaks like Ebola, GIS has been used to improve the quality of our lives and help to inform important decisions. Now, this technology is helping scientists to explore things outside of our planet. GIS is now being used to explore space.
Like many newer ventures, starting near home is where the most progress is initially made. In the mid to late 1990s the Celmentine spacecraft was launched with the a large amount of equipment to be used to extensively photograph the moon. This effort produced many high resolution photos of the geography of the moon. However, it would take the combined work of two GIS specialists, the Behee brothers, to analyze these and remotely sensed topographic data to create a geographic map of the near side of the moon.
Since that time, the use of geographic information science to study the moon has taken off. In 2012, the United States’s NASA began another moon mission called the Gravity Recovery and Interior Laboratory (GRAIL).
The goal of the GRAIL mission was to extensively study lunar gravity and help scientists more fully understand how rocky planets were formed. This was done by using two twin spacecrafts that essentially chased each other around the moon. Based upon the strength of the gravitational pull, the distance between the two would change.
This data allowed scientists to map the gravitational pull of the moon and determine the types of rocks that were likely forming the crust. The spacecrafts were also able to collect a significant amount of other topographical data that enabled researchers to estimate the thickness of the moon’s crust and added data to our knowledge of the moon’s thermal history.
NASA’s Scientific Visualization Studio has been using all of this information to produce a number of colorful maps of the moon that have made it much easier to visualize all of the results and learn from them. Data collected from this mission are still being analyzed and new results are released periodically.
Successes related to this work have encouraged GIS-based space exploration on a much larger scale. Recent work, especially on Mars, has resulted in many high resolution images that are being analyzed by GIS specialists to create topographic maps of the planet. Additionally, Mercury crater deposits, Venus topography, and a general map of the locations of stars have been worked on.
All of these extensive data sets help us to better understand how the Earth came to be and it enriches our understanding of our place within the universe. Furthermore, using GIS in space exploration extends our knowledge as to our capabilities of survival outside of Earth’s atmosphere. These exciting discoveries are only the beginning, and the future looks very bright.


#


Next article

The reflection of radar waves on the surface highly depends on the dielectric properties of the impacted objects. Among other things, the radar wave is reflected by water and objects containing water. Since the radar sensor is always inclined to the side, still water bodies reflect the wave off the sensor forwarding it in the according angle and same direction it came from. Therefore, still water bodies are areas with missing information on reflected waves. They appear as black areas and distinguish themselves from the displayed grey or white remaining land terrain. Hence, radar intensity images are highly eneficial for flood mapping.
Between January 9 and 11 2015 two winter storms passed over Denmark issuing flood warnings for different parts of the country. To map the extent of the flooding, the water management company DHI used radar intensity images from the German space borne satellite TerraSar-X. The advantage of radar images lies in their ability to be independent from weather and light conditions. It is possible to acquire radar images during the night and regardless of the current weather conditions such like heavy wind, massive cloud and rain. – Only heavy rain clouds will reflect radar waves at the X-band, which is used by TerraSar-X. The images were provided by Airbus Defence and Space, which has the commercial distribution of the images.
The image below shows flooded areas in Northern Jutland around Limfjorden, Denmark. The flooded areas are indicated by the light blue colour. Oceans appear as dark surfaces (as the waves are also reflected there), whereas the inland areas are displayed as grey or white surfaces.
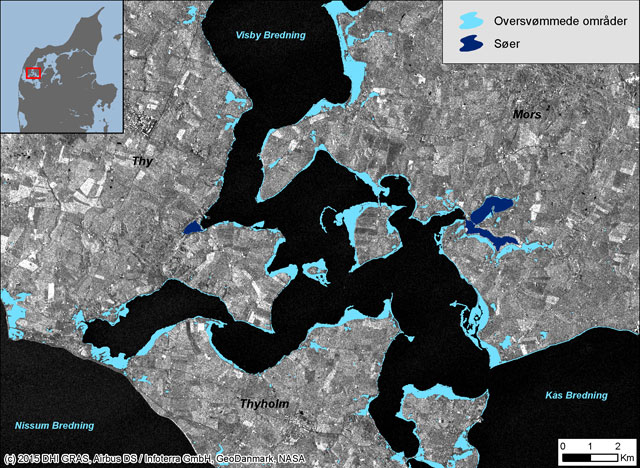
Flooded area over Northern Jutland demarked as liht blue surfaces. Source: Geospatial Solutions
Source: Geospatial Solution