Smell is important yet the most unappreciated sense. It is the only sense which is almost impossible to imitate by technology. Look at our smartphones. They see, they hear, they sense our touch but they don’t recognise odours, and I don’t expect them to do it anytime soon.
A group of researchers from Cambridge University in consortium with Yahoo decided to map smells across London. Since it is impossible to measure it with any known technology they went for a totally different approach. First they asked dozens of residents in couple of cities in Europe and the U.S. to conduct “smell walks,” in which they walked around, identified distinct odors and took notes on what they were smelling. This exercise allowed to create a detailed urban smell dictionary.

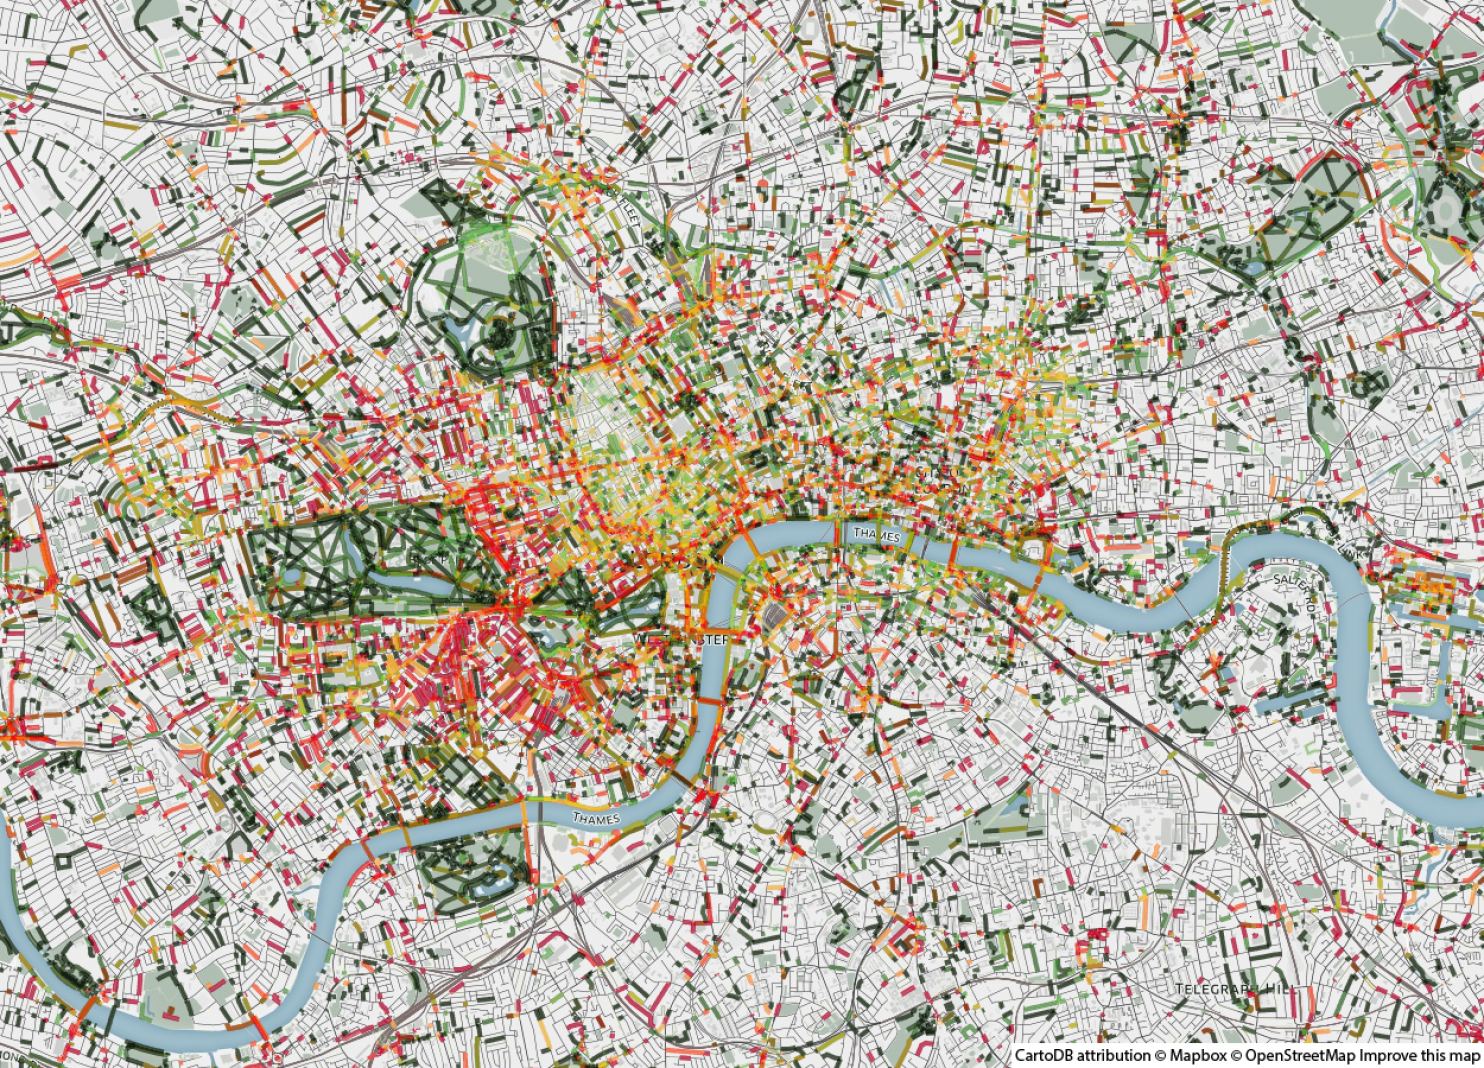
Then researcher crunched geotagged data from social media searching for these keywords. In total they sampled 17 million Flickr images, 436,000 Instagram posts, and 1.7 million tweets published and geotagged between 2010 and 2014. The effect has been mapped using CartoDB and is kind of cool.
The data can be analysed separately per layer. Let’s compare smells of emission (red) and nature (green) on the first map with Animal odour on the map below. Unsurprisingly the animal smell and the nature concentrates in London’s zoo and in parks, and “emission” odours follow the city’s major roadways.

The researchers envision these maps being used in a variety of ways. Urban planners cloud use them to figure out which areas of the city smell the worst and manipulate urban green spaces to change it. Geo-geeks cloud create a wayfinding app that gives users the most pleasant-smelling path to their destination. Do you have any other ideas?

#Business


Next article


Working with geographic data typically implies the use of some software. At the beginning of the GIS age, from the 1980s on, the “blockbusters” of geographic software production such as ESRI, ERDAS and MapInfo were the first to realize the concept of splitting spatial and attribute information. They were almost solely available on the market, often with a program specific file format as the famous ESRI shapefile. In a second generation approach the attribute data were organised into database structures. Parallel, the MOSS ( initially Federation of Rocky Mountain States) and GRASS (U.S. Army Corp of Engineering Research Laboratory“ in Champaign, Illinois) were the first public domain, open source freewares. The first of them deployed for use was MOSS in 1979. Both were successfully installed and used by different U.S. federal agencies. The situation began to change with the increase of GIS users by the end of the 20th century and the development of the internet. Geographic data could be explored by everybody via the internet. The rapid growth of users and application range required the standardisation of file formats and file transfer. Various systems have been consolidated and standardized.
In the last ten years, an explosion of open source software overwhelmed the IT domain, from which also the GIS environment could profit. A growing number of free, open-source GIS packages run on a range of operating systems and can be customized to perform specific tasks. Increasingly geospatial data and mapping applications are being made available via the world wide web.
R contributes such an open sources software that can be used to work with geographic data. Initially founded as a mathematical and statistical software, today it can read and manipulate data that have spatio-temporal information. The unique advantage of open source software is its concept of expandability: the application range of the initial software foundation can be extended by adding respective code. Thus, the extension of software is pushed by practical application needs. Open source software is widely used in the academic domain due to financial advantages and to follow a liberal strategy with no dependencies from commercial software restrictions.
Over the time, several “packages” were added to R software, that can deal with both, vector and raster formats, can manipulate those data considering typical geographic issues such as projection or pixel size etc., represent them and write them into proper files. Also for the commercial environment the freeware as R is advantageous. Just to give a simple application example: If you are working with rectangle pixels, ArcGIS will always create squared ones, while R keeps the initial pixel shape (ERDAS or GlobalMapper keep it as well).
Please see an overview of the spatial software packages in R:
adehabitat: A collection of tools for the analysis of animal movements (spatio-temporal analysis)
DCluster: A set of functions for the detection of spatial clusters of disease using count data. Bootstrap is used to estimate sampling distributions of statistics.
geoR: Geostatistical analysis including traditional, likelihood-based and Bayesian methods.
geospt: Geostatistical analysis and design of optimal spatial sampling networks.
Gstat: Provides functions for spatial and spatio-temporal geostatistical modelling, prediction and simulation. Variogram modelling; simple, ordinary and universal point or block (co)kriging; spatio-temporal kriging; sequential Gaussian or indicator (co)simulation; variogram and variogram map plotting utility functions.
fields: Fields is for curve, surface and function fitting with an emphasis on splines, spatial data and spatial statistics.
intamap: A package that provides classes and methods for automated spatial interpolation.
landsat: Processing of Landsat or other multispectral satellite imagery. Includes relative normalization, image-based radiometric correction, and topographic correction options.
lattice: Lattice is a powerful and elegant high-level data visualization system, with an emphasis on multivariate data, that is sufficient for typical graphics needs, and is also flexible enough to handle most nonstandard requirements.
maps: Most important package to visualise geographic data. Display of maps. Projection code and larger maps are in separate packages (mapproj and mapdata).
maptools: tools for reading and writing spatial data (visualisation). Set of tools for manipulating and reading geographic data, in particular ESRI shapefiles; C code used from shapelib. It includes binary access to GSHHG shoreline files. The package also provides interface wrappers for exchanging spatial objects with packages such as PBSmapping, spatstat, maps, RArcInfo, Stata tmap, WinBUGS, Mondrian, and others.
mapproj: Converts latitude/longitude into projected coordinates.
modis: Provides several functions for downloading, storing and processing subsets of MODIS Land Processes data as a batch process.
Ncdf: This package provides a high-level R interface to Unidata’s netCDF data files
raster: Reading, writing, manipulating, analyzing and modeling of gridded spatial data. The package implements basic and high-level functions. Processing of very large files is supported.
RasterVis: Methods for enhanced visualization and interaction with raster data. It implements visualization methods for quantitative data and categorical data, both for univariate and multivariate rasters. It also provides methods to display spatiotemporal rasters, and vector fields. See the website for examples.
Rgdal: Provides the most important and basic spatial functionalities. Provides bindings to Frank Warmerdam’s Geospatial Data Abstraction Library (GDAL) (>= 1.6.3, < 2) and access to projection/transformation operations from the PROJ.4 library. The GDAL and PROJ.4 libraries are external to the package, and, when installing the package from source, must be correctly installed first. Both GDAL raster and OGR vector map data can be imported into R, and GDAL raster data and OGR vector data exported. Use is made of classes defined in the sp package. Windows and Mac Intel OS X binaries (including GDAL, PROJ.4 and Expat) are provided on CRAN.
Rgeos: Interface to Geometry Engine – Open Source (GEOS) using the C API for topology operations on geometries. The GEOS library is external to the package, and, when installing the package from source, must be correctly installed first. Windows and Mac Intel OS X binaries are provided on CRAN.
RPostgreSQL: Database interface and PostgreSQL driver for R This package provides a Database Interface (DBI) compliant driver for R to access PostgreSQL database systems.
Sp: provides classes and functions for spatial data. Utility functions are provided, e.g. for plotting data as maps, spatial selection, as well as methods for retrieving coordinates, for subsetting, print, summary, etc.
spacetime: Classes and methods for spatio-temporal data, including space-time regular lattices, sparse lattices, irregular data, and trajectories; utility functions for plotting data as map sequences (lattice or animation) or multiple time series; methods for spatial and temporal selection and subsetting, as well as for spatial/temporal/spatio-temporal combining or aggregating, retrieving coordinates, print, summary, etc.
spatial: Provides functions of kriging and point pattern analysis
spatstat: Important packages for spatial statistics and geostatistics. Provides spatial point pattern analysis, model-fitting, simulation, testings.
Spdep: spatial dependence, weighting schemes, statistics and models.
spgrass6: Interface between GRASS 6+ geographical information system and R
spTimer: Spatio-temporal Bayesian modelling using R.
Cshapes: Package for CShapes, a GIS dataset of country boundaries (1946-2012). Includes functions for data extraction and the computation of distance matrices and -lists.
DeducerSpatial: A Deducer plug-in for spatial data analysis. Includes The ability to plot and explore open street map and Bing satellite images.