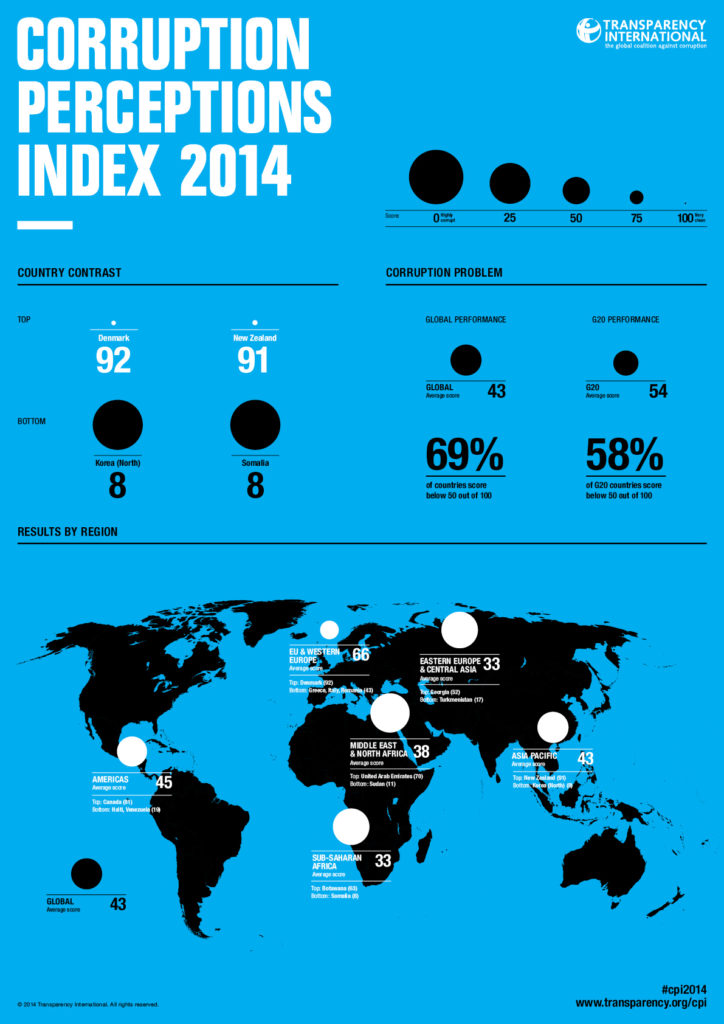

Transparency International published their annual report on global corruption. The Corruption Perceptions Index ranks all countries by their perceived levels of corruption, as determined by expert assessments and opinion surveys. The top score a country can get is 100. The best rated country is Denmark with a score of 92, followed by New Zealand on 91 and Finland on 89. At the other end of the scale, Somalia and North Korea shared joint last place with a score of just 8 points.
From our perspective the most interesting feature of the project is of course the interactive map. The solution is based on Mapbox API and it’s quite cool. The choropleth map shows the actual value of the Index in each country. You can zoom in and out as well as point on a particular country to get more details. Simple but very practical.
The results of the report are also presented on that cool infographic:

source: Transparency International

#Ideas


Next article
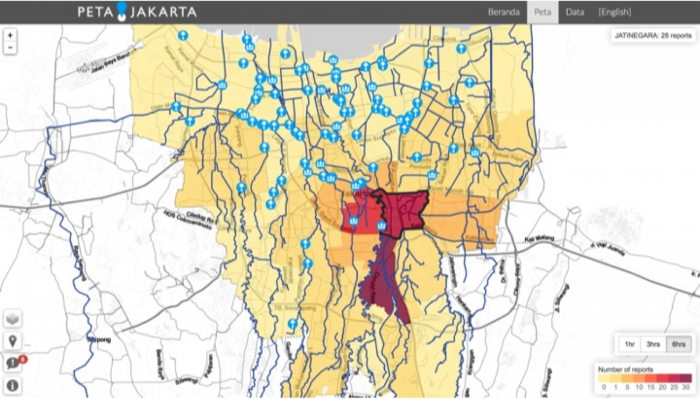
Every year between November and April the streets of Jakarta – the capital of Indonesia – are turning into rivers causing massive problems for commuters and residents. Old draining infrastructure is not able to handle rainy season downpours. According to the emergency management agency of Jakarta, more than one million people in the city were affected by the Great Flood in January 2013.
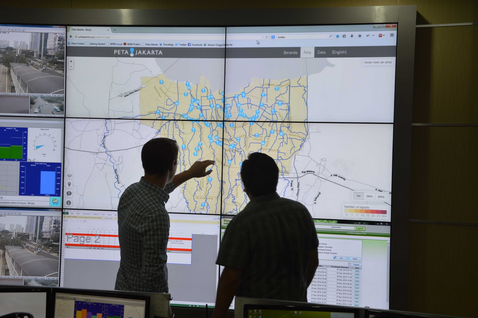 The city of Jakarta together with SMART Infrastructure Facility of the University of Wollongong in Australia introduced a new crowd-sourced solution called PetaJakarta for warning citizens about when and where floods are occurring. The idea is simple: when someone sees a flood in Jakarta, all they have to do is tweet #banjir @petajkt (meaning #flood and @MapJKT). These flood-related tweets will then be mapped on the PetaJakarta.org platform for citizens to monitor the live situation and stay safer, and to provide a real-time data for disaster response tool in Jakarta’s emergency management agency control room.
The project is a first-in-the-world collaboration between a disaster management agency, a university and Twitter to use social data to both build a working model and provide real-time response to a natural disaster. It’s a really great solution for a country with high adoption of smartphones and high flooding problem. In Europe the problem of floods is a little bit different. It’s seasonal but it can be anticipated earlier. Check out this post to learn about UK flood warning system.
source: Gigaom