
I work in the company that specializes in location-based data analytics. One of our core businesses is providing road traffic data for Central-Eastern Europe. We monitor hundreds of thousands of GPS equipped vehicles and analyse location-based data to provide precise traffic information for companies like Google, TomTom, Garmin and others. When we plot GPS track points from one day we get very precise dot map of road network in the whole region. Now imagine what happens when you plot on the map all Foursquare check-ins from last three months – that’s 500,000,000 (half a billion) check-ins!
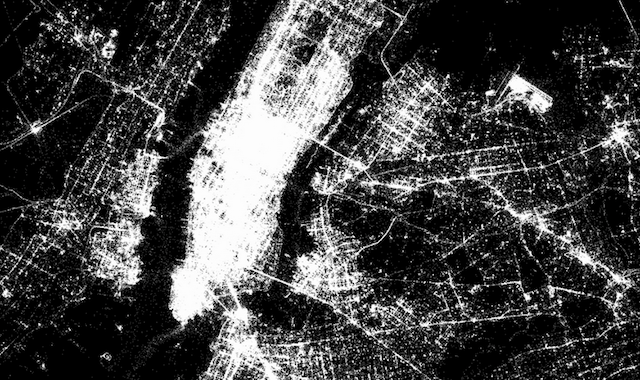
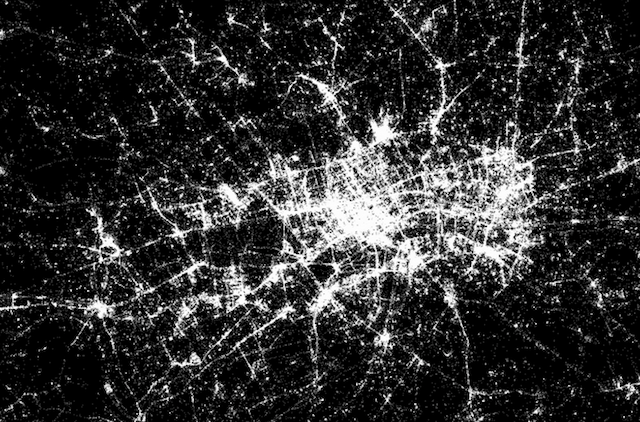
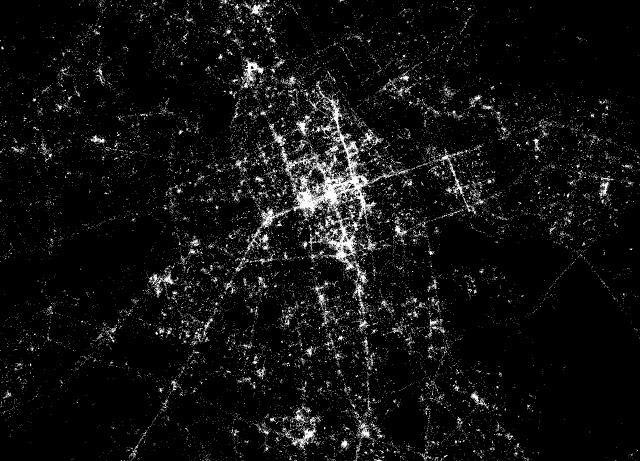
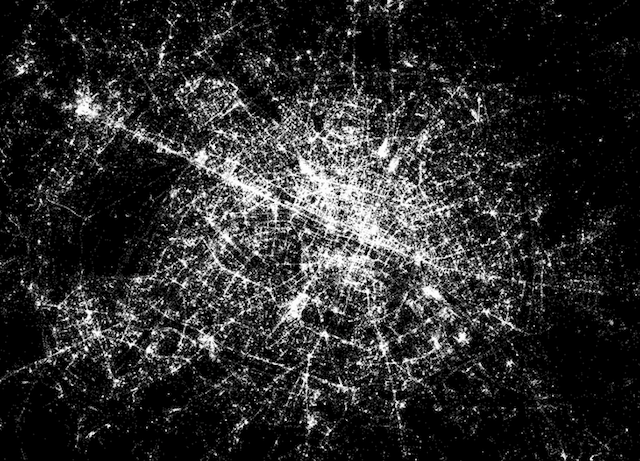
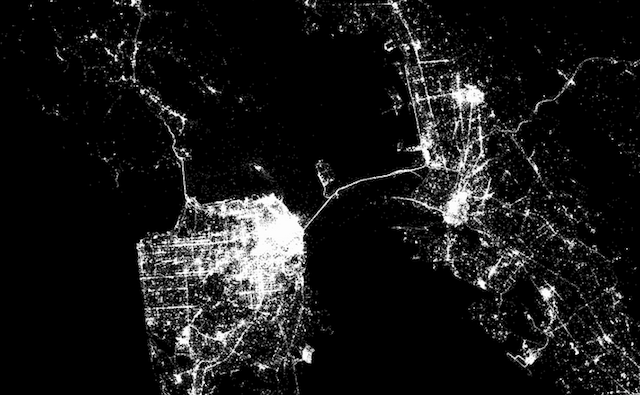
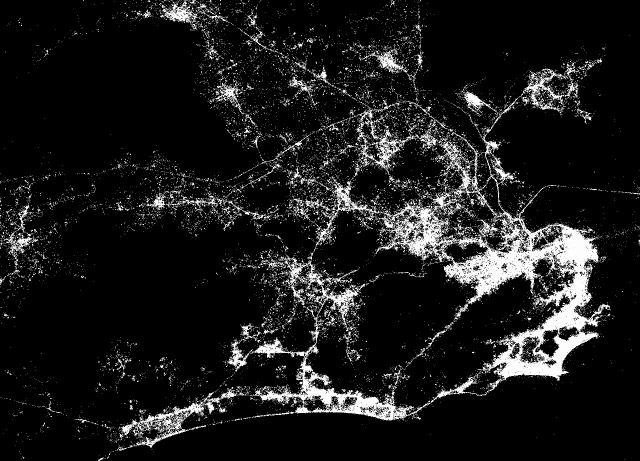
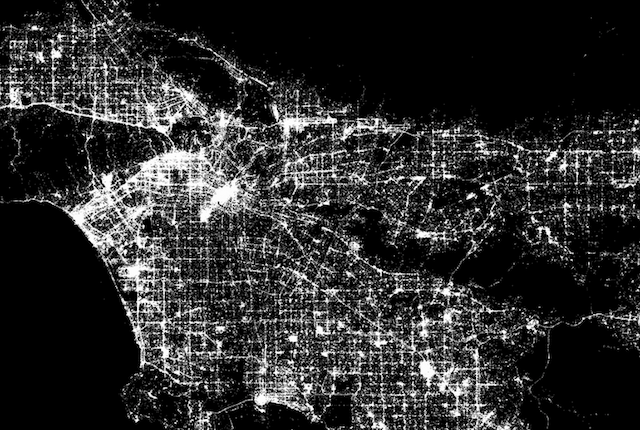
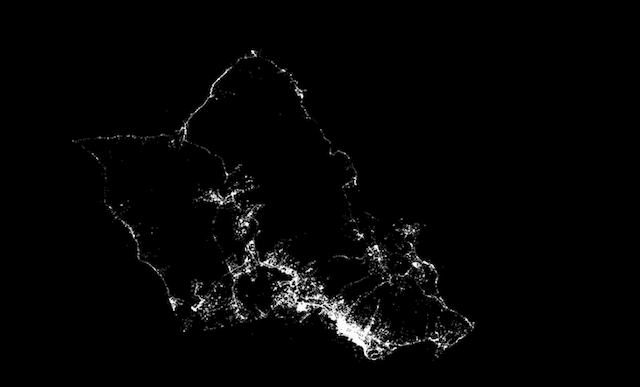
Foursquare has published 500 million map with all check-ins for the whole world plotted. Check out the images below. I think that they don’t require any comments… Can you recognise your city?
New York
London
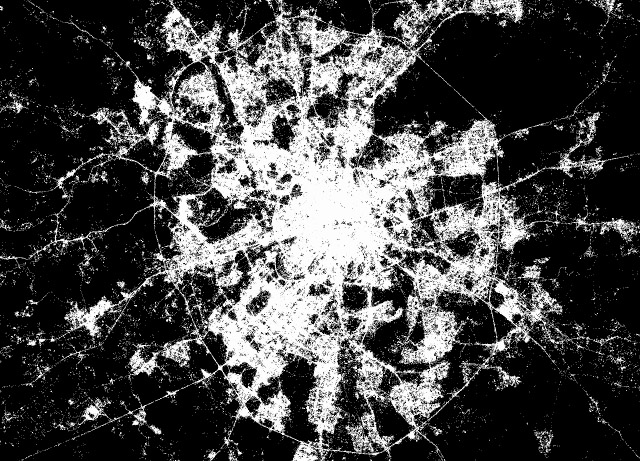
Warsaw
Paris
New Delphi
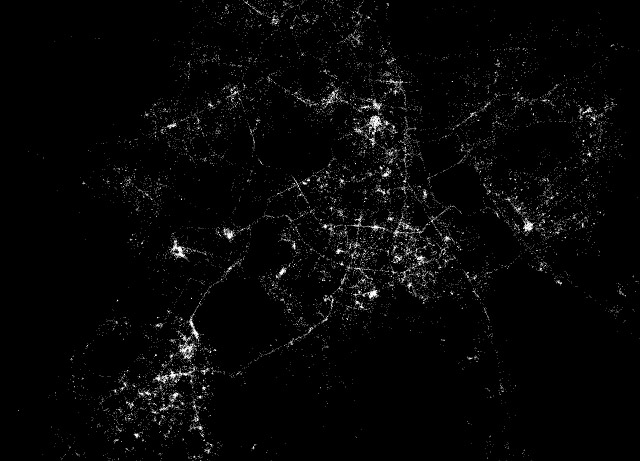
Moscow
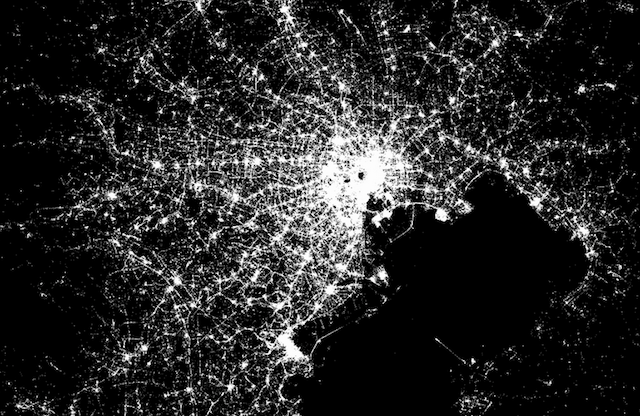
Tokyo
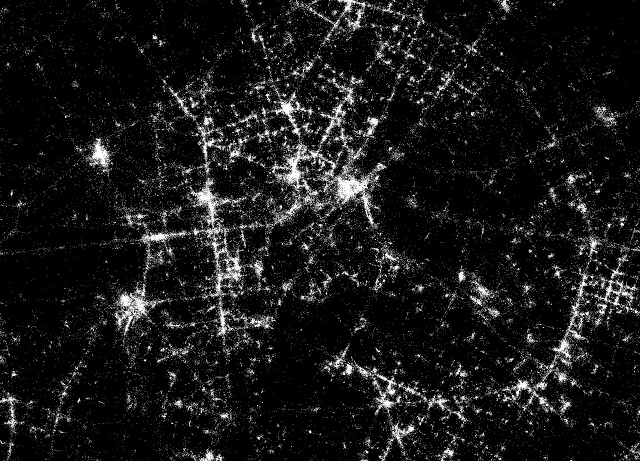
Berlin
San Francisco
Ri0 De Janeiro
LA
Oahu Island (Hawaii)
source: Gizmodo

#Ideas

Next article

 “High-quality planetary maps and 3D terrain models have become essential for NASA to plan exploration missions and conduct science,” says Google in the video description. “This is particularly true for robotic missions to the Moon and Mars, where maps are used for site selection, traverse planning, and planetary science. This is also important for studies of climate change on Earth, where maps are used to track environmental change (such as polar ice movement).”
In the video below, Ross Beyers from Carl Sagan Center at the SETI Institute of Intelligent Robotics Group at NASA Research Center discusses on how the build high quality large-scale planetary maps and 3D terrain models to explore the Moon and Mars.
Make sure you watch the video and get inspired.
Source: Mapcite.com