How to make a killer map using Excel in under 5 minutes with PowerMap plugin

Many times it happens that you need to quickly visualize your data on a map but you don’t have a time to play for hours with ArcGIS or QGIS to make it look good. In this tutorial I’ll show you how make an awesome looking map in Excel in under 5 minutes with a free plugin called PowerMap (formerly GeoFlow).
1. Download and install the plugin.
Of course the first step would be to download and install the plugin from Microsoft website. You should download it and install without any issues. 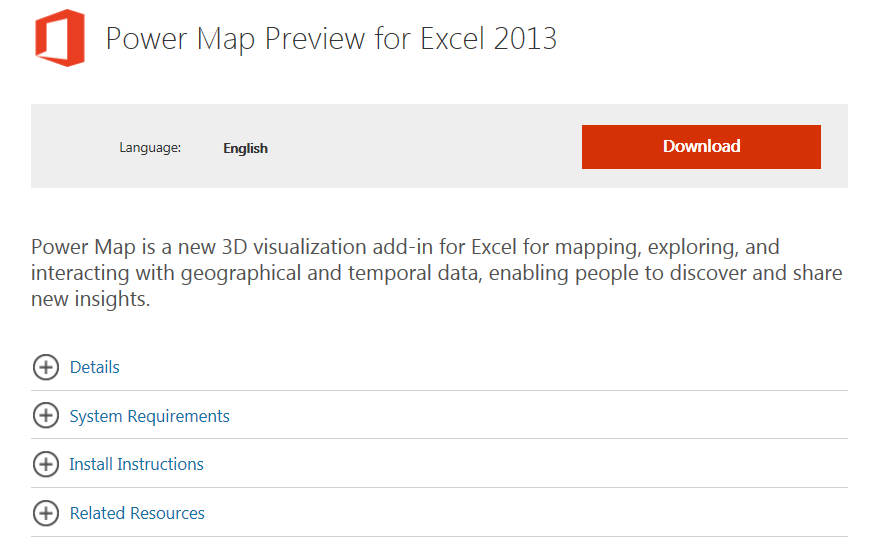 Initially the plugin was restricted only for MS Office 365 subscribers and owners of an expensive MS Office Professional Plus suite but recently it has been released for all MS Excel 2013 users. Both 32bit and 64bit Windows version are supported but it will work only with Excel 2013 (no previous Excel version is supported). It won’t work on any other operating system though. If you successfully install the plugin, you should be able to see it in your Excel under the “INSERT” tab.
  If you don’t see it you might need to activate it in Add-Ins menu. To do that go to File -> Option -> Add-Ins. You should the following window:
 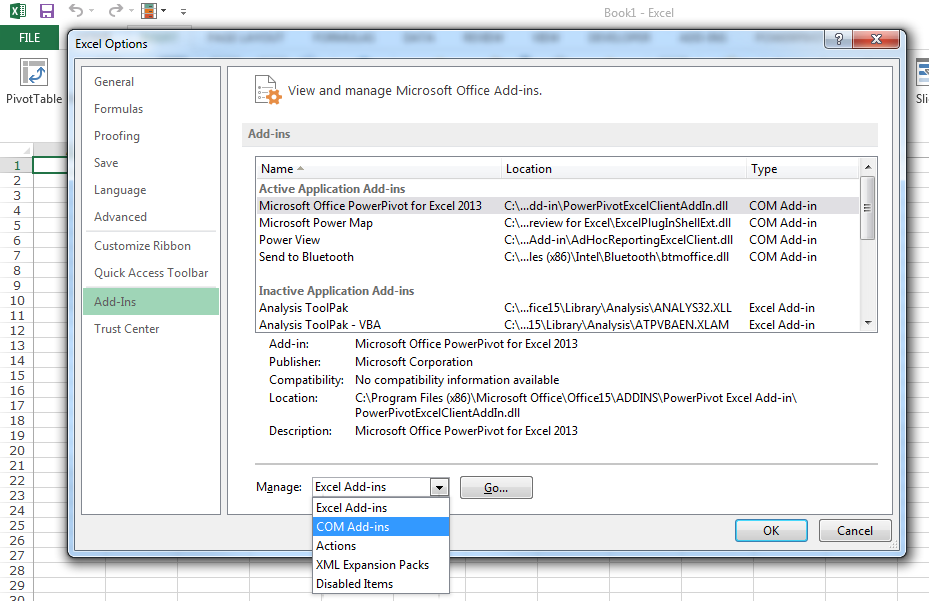 In the dropdown list on the bottom of the window select COM Add-ins and click GO. Now select Microsoft Power Map and click on OK button to activate it.
 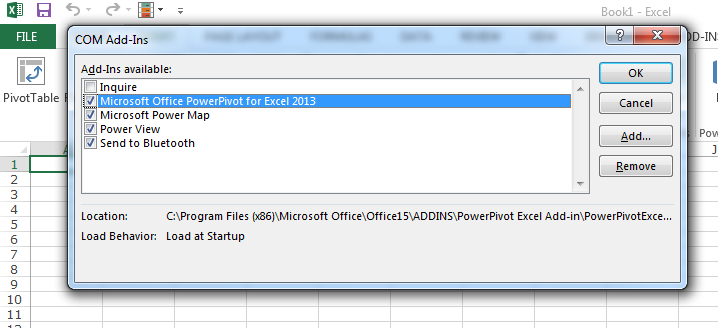 Now everything should work fine. The most difficult part is behind us:). Let’s start mapping.
2. Prepare your data.
Now its time to prepare your data. Power Map gives a couple of options to visualise it. The most obvious is to use coordinates. In this method you need to have two separates columns for latitudes and longitudes. There are a couple of cool things you can do with that and we will cover it in the future #GeoawesomeHoTo. Today lets focus on another great option of the plugin – geocoding.
Geocoding is a process which allows you to pinpoint a geographic location based on a description e.g. address, city name, postal code, country name etc. For the purpose of this tutorial I took a list of the largest agglomerations by population from Wikipedia. Selected the table in a web browser and copied it directly to Excel. Than I pressed “Text to Columns” button in the DATA tab and I came up with the following table.
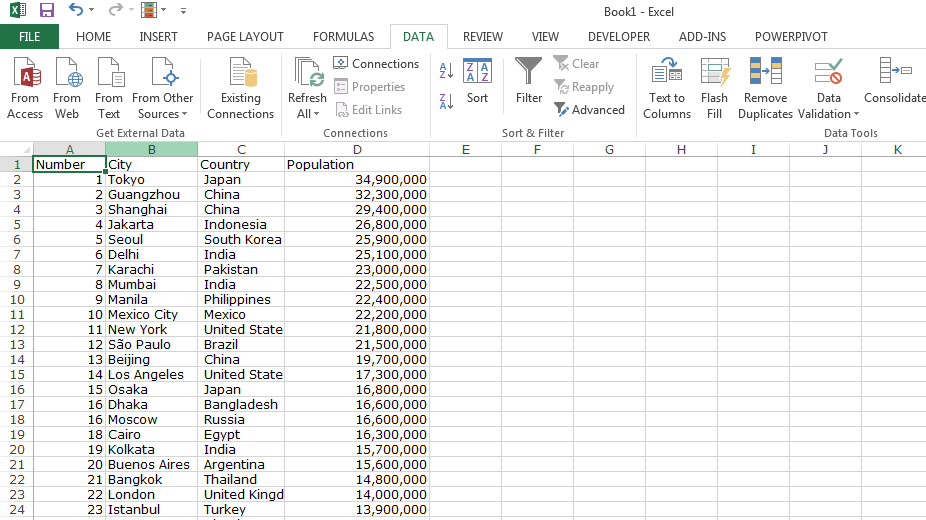
Geocoding will allow me to show a phenomena on a map based on a city or a country name. It will automatically connect the record to a centroid of a city or a country without a need to give a geographic coordinates.
This is it. Now we can start mapping:).
3. Select you data.
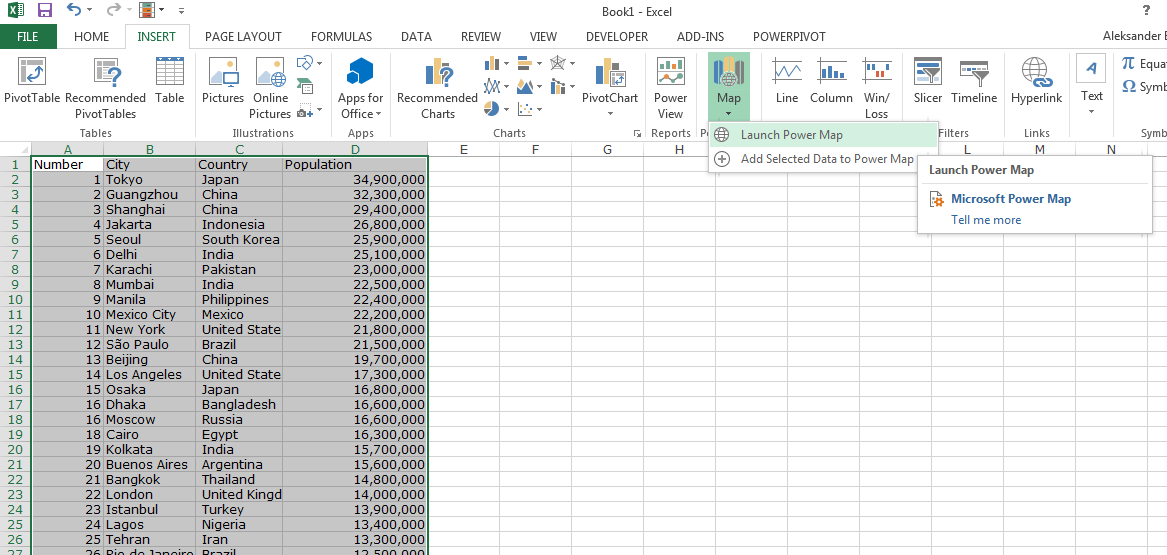
Now you just need to select the data you want to map, in my case it would be the whole table, go to INSERT tab, and click on a “Map” icon, which we’ve added to the menu at the beginning of the tutorial. Click on “Launch Power Map” and here we go.
4. Create a map.
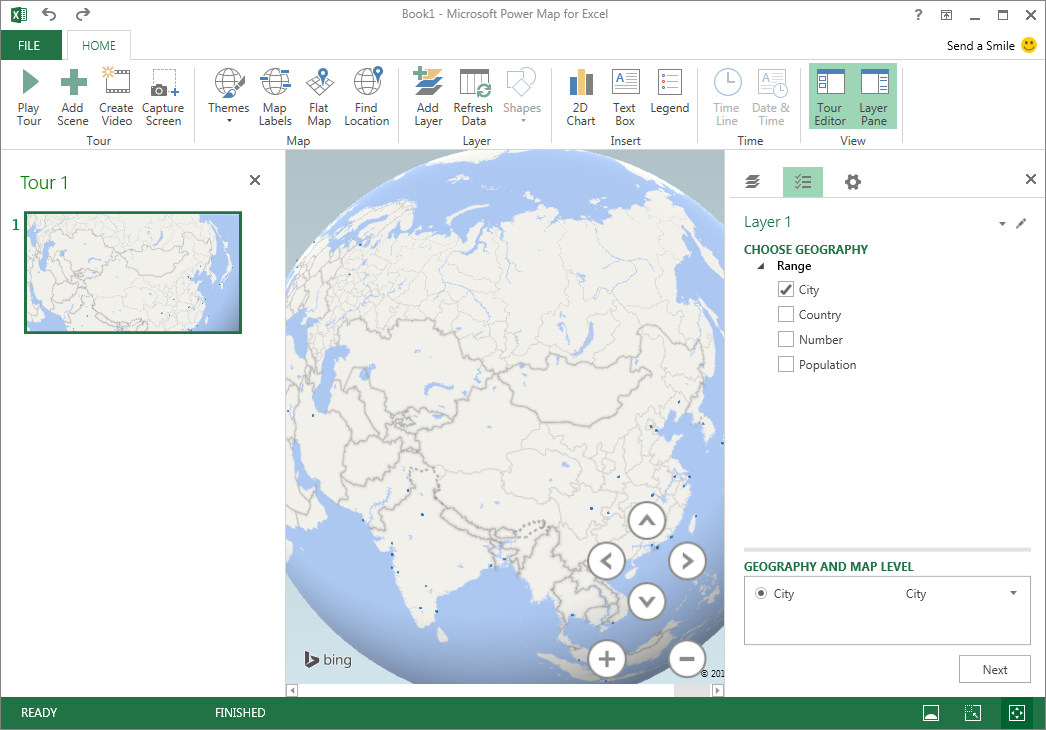
The Power Map window will pop-up on your screen. Below you can see that plugin automatically detected two parameters from our table “City” and “Country”. Based on these two columns Power Map will join the name to a centroid of a Country or a City on our list. In that case we are interested in visualizing the data for cities, so we should select only this option.
After choosing “the geography” click on the NEXT button in the bottom-right side of the page. You will be moved to the settings menu. Now you need to select which data you want to visualize. In our case we’ve got only the Population column, so we should select it. Below that there is a menu to select how you want to visualize the data. There are 5 options:
- Stacked Columns
- Clustered Columns
- Bubble
- Heat Map
- Region
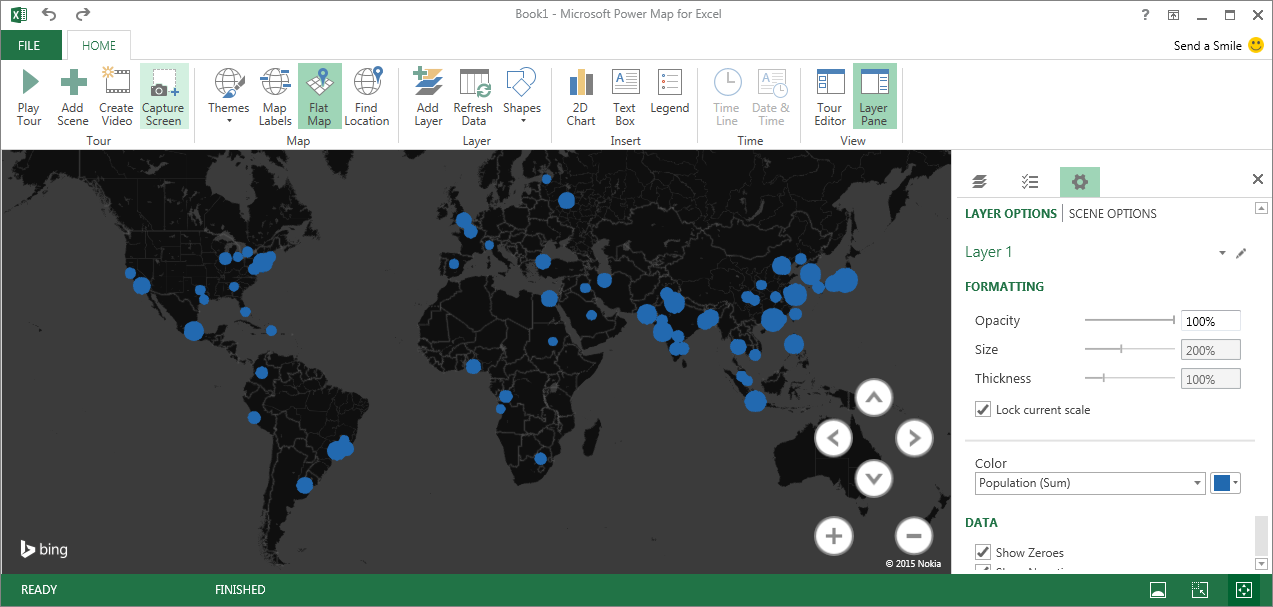
As you can see on the example below I’ve selected the Bubbles.
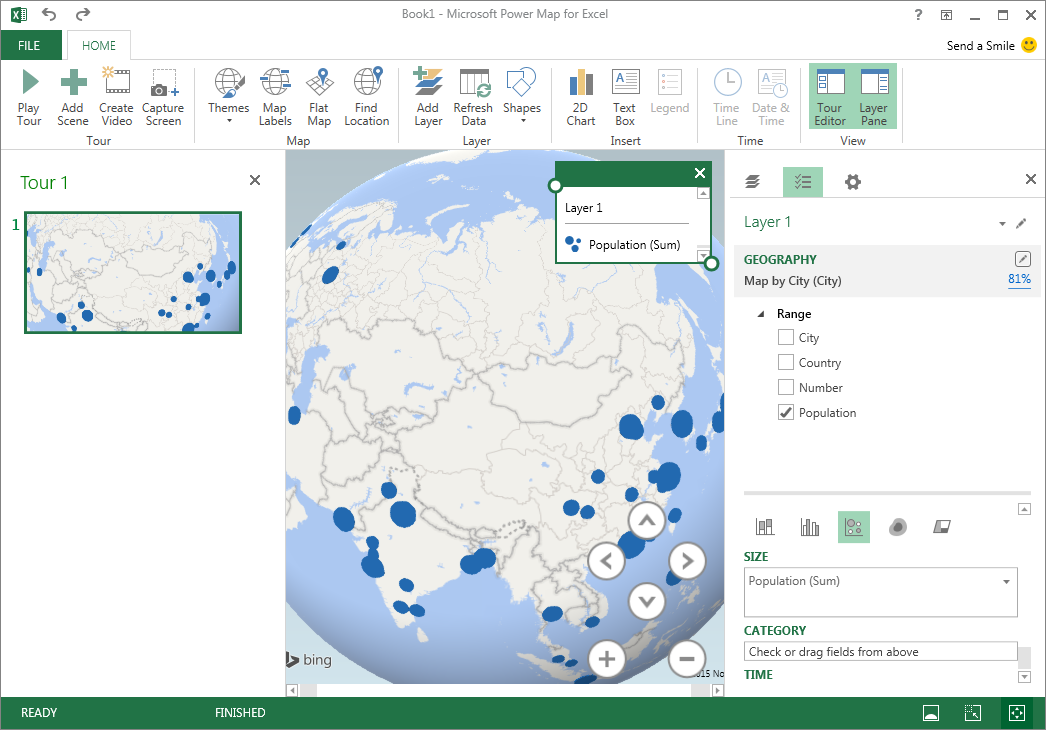
Now it’s time to play with the visualization and Power Map gives plenty of cool features to do that. You can Flat the map, you can select one of the predefined map themes, add text description (via Text Box) and so one. You can also play with the data visualization. Under settings menu on the right side you can change the opacity, size and thickness of your data points. You can also select a color. The size of the bubbles will change with the map scale so you can select “Lock current scale” if you want to keep make them look the same when you zoom in or zoom out.
5. Save the map
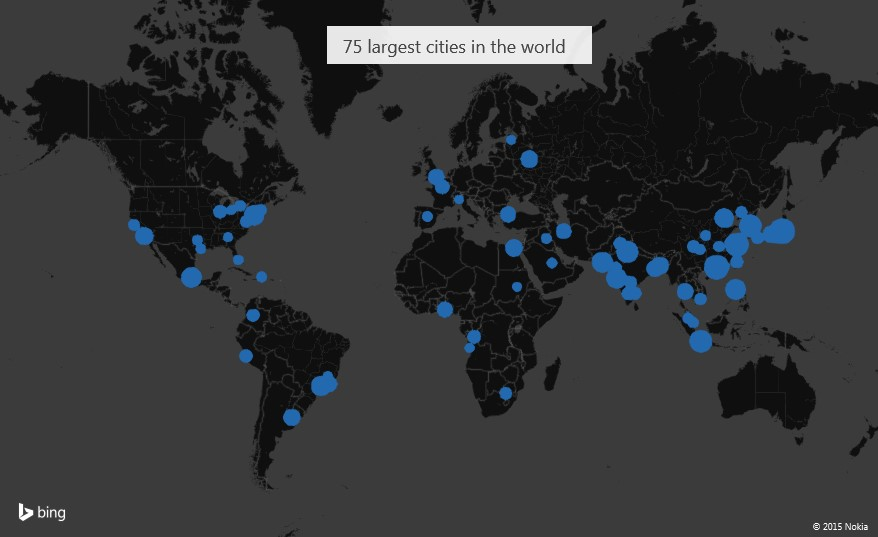
Our map is ready! We can present it directly in Power Map to maintain the interactive features or we can save it as a picture. To do that we just need to press the button “Capture Screen” in the main menu and paste (Ctrl + V) the picture to any graphical editor like Paint or a Photoshop.
Here we are. Awesome looking map of the population of 75 largest cities in the world in under 5 minutes! Have fun!

#Business


Next article

![]() Automated Driving and Driver-less cars are definitely one of the most exciting tech projects in development and they have constantly been in news for a while now.
Automated Driving and Driver-less cars are definitely one of the most exciting tech projects in development and they have constantly been in news for a while now.
We at Geoawesomeness had the pleasure of talking to Mr. Dietmar Rabel, Head, Product Management for Automated Driving and Mr. Christopher Lawton, Communications Manager about here’s vision for the automated driving project. Read on.
Tell us about Here’s Automated Driving Project
Dietmar Rabel (DR): We started, 16 years ago to be precise with with map enabled aided systems. The first time vehicles were using maps, it was to enhance vehicle functions like helping the front lights steer in the right direction and so on. This was the very beginning of using maps for aided systems, 16 years ago.
Our vision at the Automated Driving group is to help the automotive industry with our Automated Driving Cloud capabilities. It is basically a cloud backend with map data, real time information about the current status of the road to cars, etc so that autonomous cars can make intelligent and informed decisions.
Few years ago, we started partnering with couple of OEM systems to investigate possibilities in the automated driving area. For the first public event, we partnered with Daimler for the Frankfurt motor show where basically a Mercedes test vehicle drove autonomously using our map data for the Bertha Benz memorial drive.
How does HERE go about making HD maps?
DR: Before we discuss the process of producing HD maps, I would like to illustrate the importance of maintaining the HD maps. For current navigation system, it is not an issue if your map data has an inaccuracy of a few meters but this is not something we can have in HD maps that autonomous cars will use. Traditionally mapping data was collected and then updated via governments, user feedback or simply by driving again in that area and so on. When we started collecting HD maps with 20cm accuracy, we used HEREs’ Lidar technology, Cameras, location sensors like GPS, etc to collect precise data and model the roads precisely.
But by only collecting the data i.e. HD maps, we cannot maintain the data. For maintenance we will have to tap into crowd sourcing. We are expecting quite a lot of vehicles are driving either autonomously or semi-autonomously will have such sensors that will detect changes in the real world that deviate from our precise HD maps and models. The vehicles will then update this information via the cloud. With crowd sourcing technology, we can maintain the HD maps and also inform other users about changes via the cloud. This is the approach at the high level.
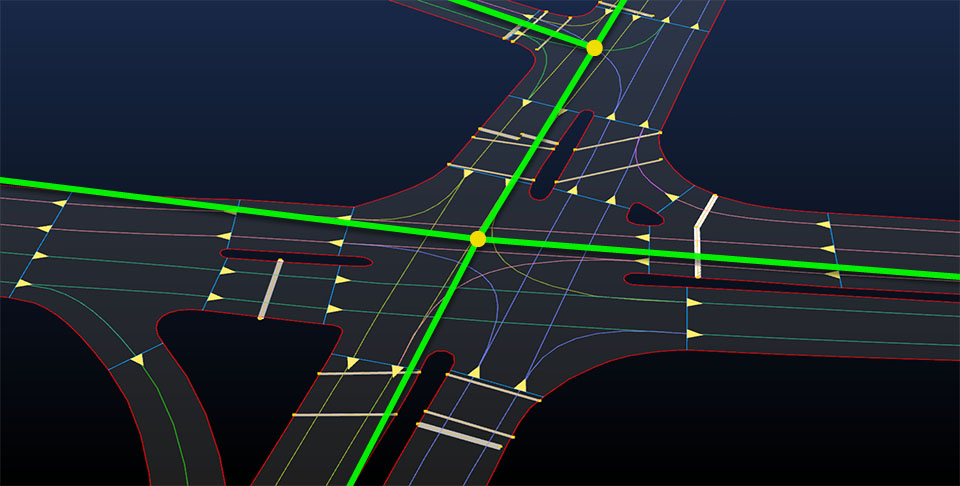
HAD Splines. (Image Courtesy HERE)
Does every autonomous cars need to have such high-end sensors for crowd sourcing?
DR: The individual vehicles don’t need to have the same level of accuracy as our mapping cars which houses really expensive Lidar sensors. The sensors in these individual vehicles simply need to detect whether something is not right anymore i.e. check the environment model that they are building and check if there is a mismatch with our model which helps us investigate these differences, maybe even send one of our HD mapping cars to resurvey. Over time of course, sensors will get more accurate and then we will get better information and then we can do better crowd sourcing, but no, not every car requires such precise sensors.
Is crowdsourcing the process of HD mapping an option?
DR: It does time to build the database for maps, it is entirely doable for us to produce HD maps for motorways using the sensors the OEMs are rolling out. One of our strengths is a global specification, the same algorithms work on our data regardless of the geographic location of the data or how it was collected. The level of accuracy required from day one is just too difficult for a crowdsourcing methodology of data collection as the number of vehicles that such sensors is really low and for crowd sourcing of HD maps, we need a lot of such vehicles. That being said, crowdsourcing will play an important role in the maintenance of the data.
How do you mitigate bad weather when it comes to autonomous driving?
DR: The challenge in localization the vehicle is that GPS can be used to get a rough overall position and then we need the lane marking sensors to try and figure out the lanes and this is going to be difficult under bad weather conditions.
In addition to lane markings, we also use localization objects like corners of a road, etc on both along the road and also across as well. This helps the lidar and radar measure their distance from such markers to accurate pinpoint the location of the car on the road. In bad weather conditions, some of the sensors will have issues, that’s why we would redundant sensors to overcome such issues; we need enough of these localization markers to ensure obstructions and bad weather conditions dont affect autonomous driving.
The technology is currently being rolled out in controlled access roads. Its a much simpler environment than cities but when we expand and enter cities and face bad weather. This is going to be an interesting challenge.
Tell us about the live roads project
DR: Basically our automated driving product strategy has three pillars – one of them is road network data, this data is mostly static but if it changes then it is important that we need to update it immediately.
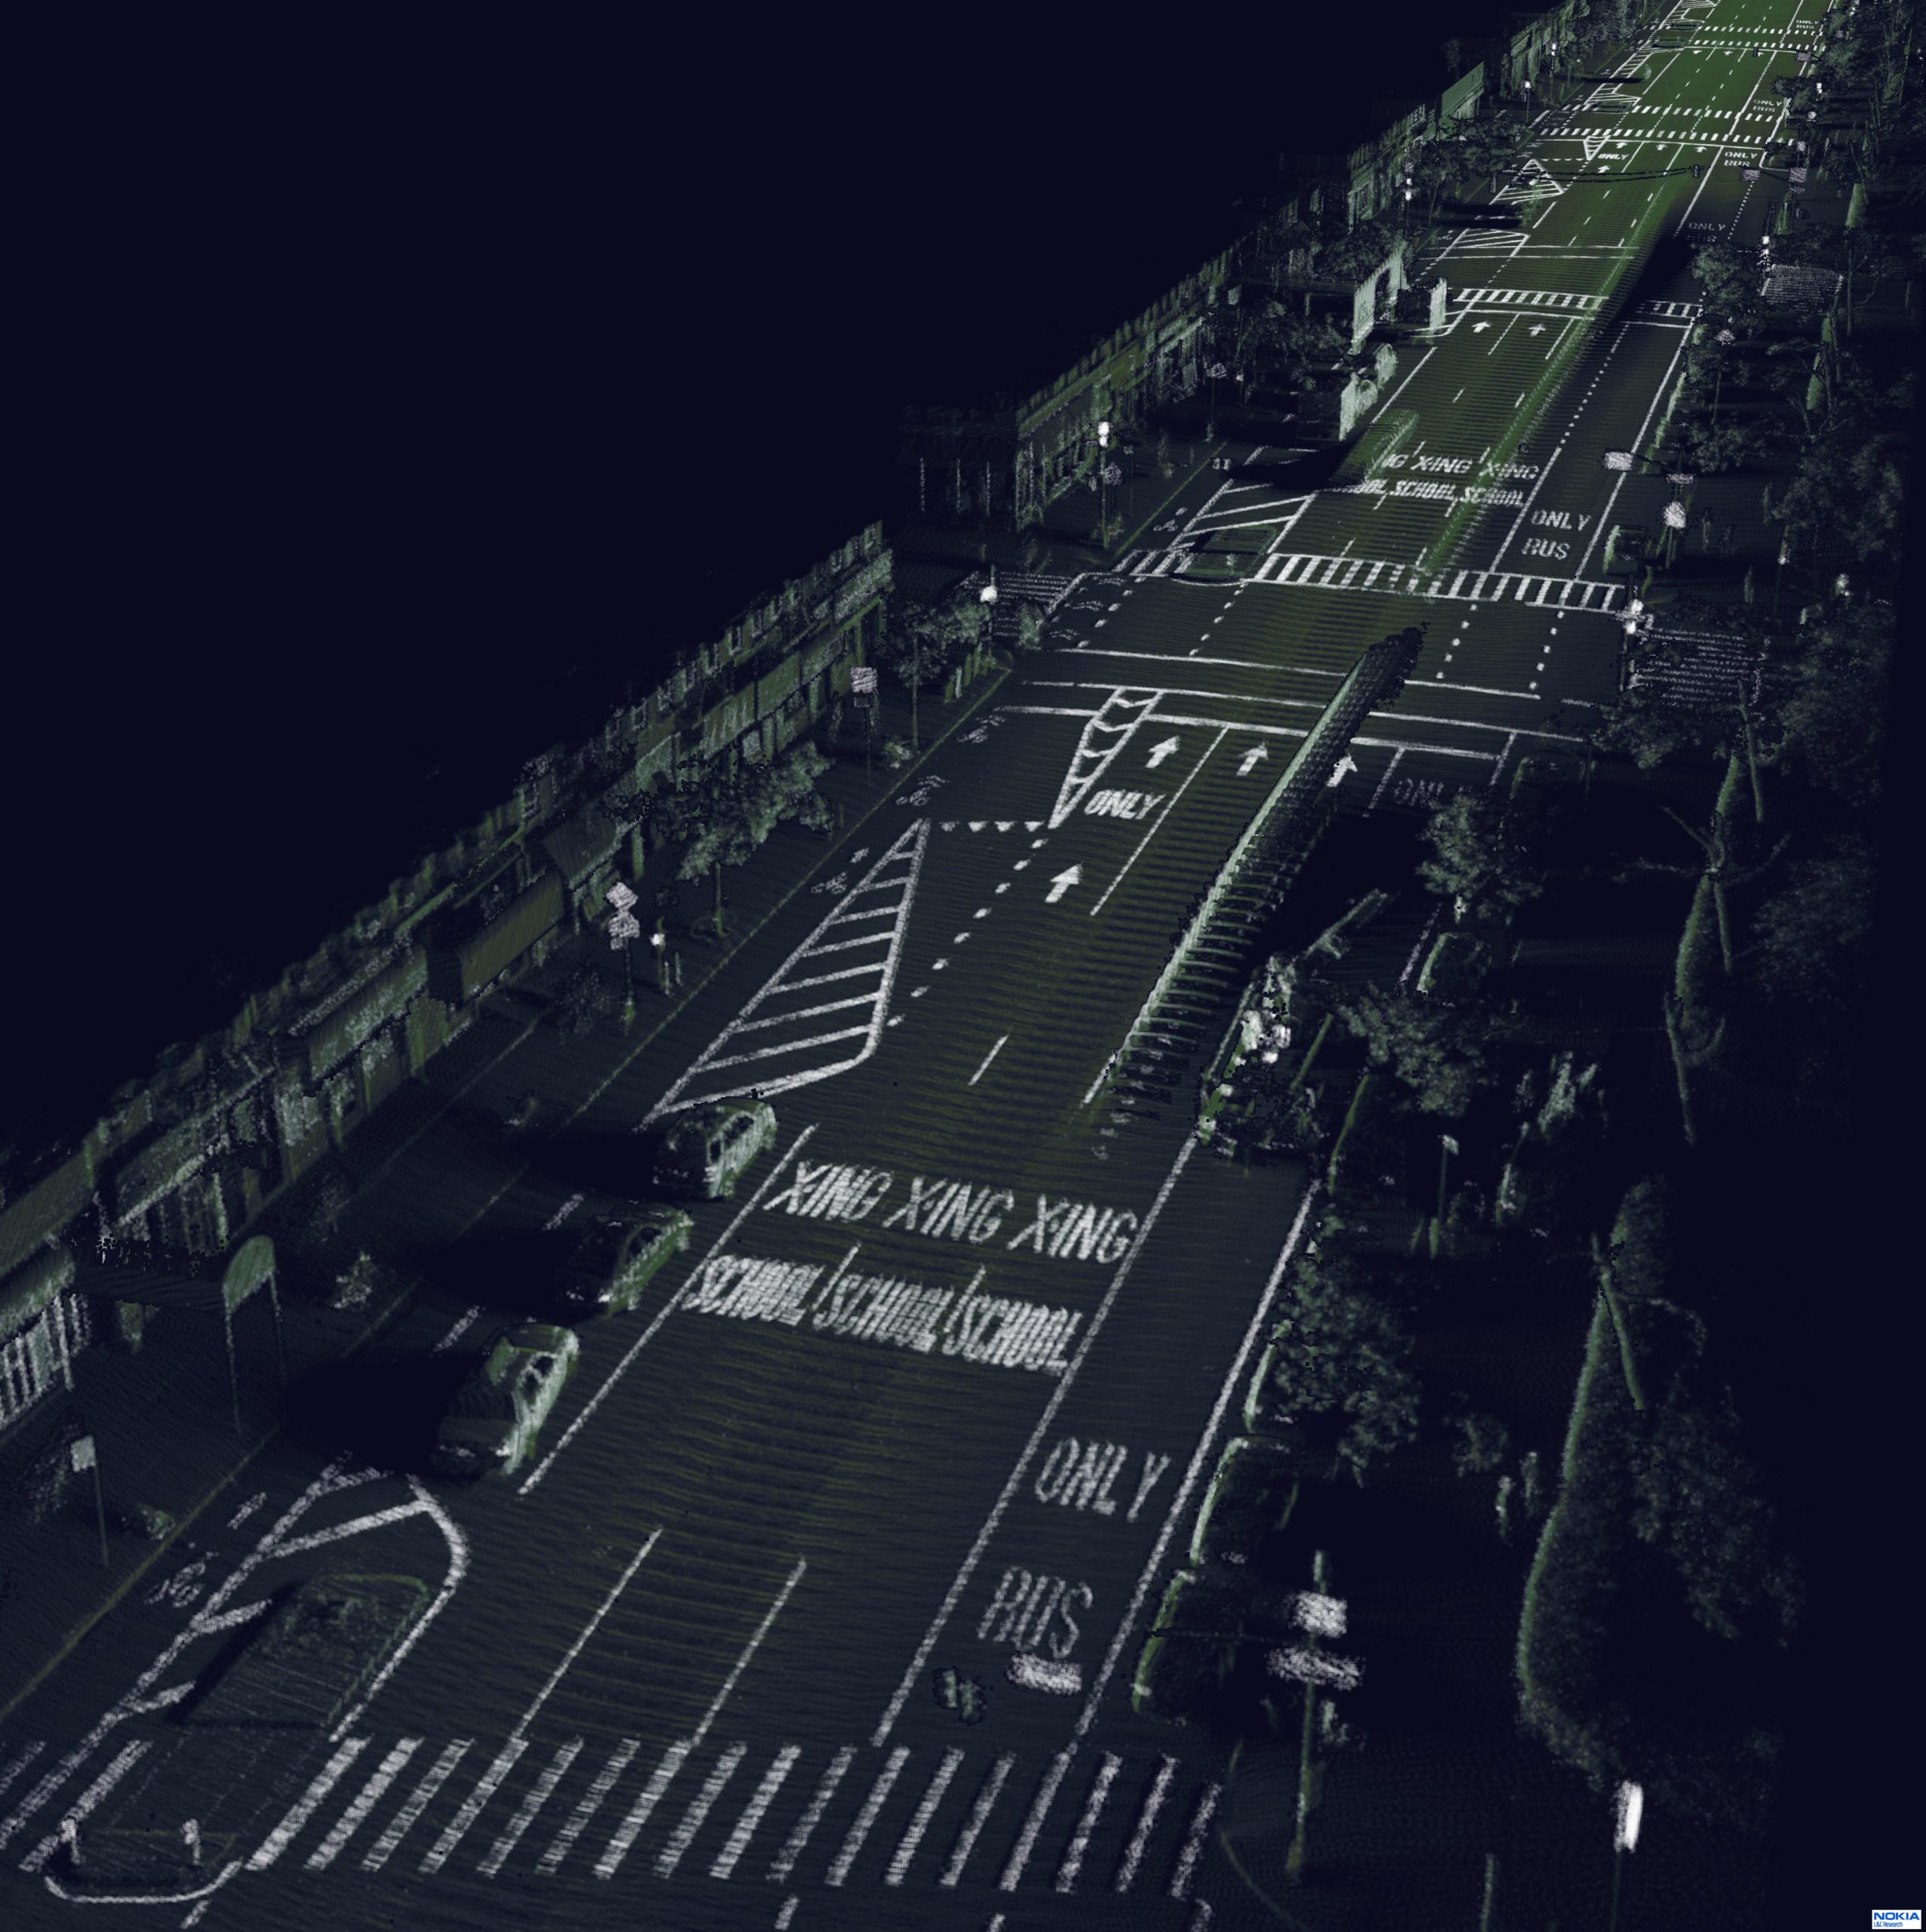
HD Maps. (Image Courtesy HERE)
Now live roads is on top of that. It is basically it is a real time view of the roads, so basically all the variable map information – slippery roads, accidents, pedestrians, visibility conditions are aggregated in the cloud and cross checked with other sources. So when a car informs the cloud that its wheels are slipping in a particular location, we quickly have to confirm whether other cars are also experiencing similar issues at this location, Maybe the slipping is caused due to snow, rain which means we need to correlate the slippage information with weather sensors. If that’s the case, we then know the car doesn’t have issues with its tires. Otherwise its important to have this information. That’s live roads.
What is the biggest challenge in mapping HD maps?
DR: The biggest challenge is not the mapping at high accuracies, its the maintenance. The data we collect is really accurate but we are very very careful with what we use as we need to maintain the data at a high accuracy and they have to be updated at a constant rate.
HERE has transformed itself from a maps company to a spatial computing and visualization power house. What’s next?
Christopher Lawton (CL): A number of trends are converging to make location the key driver of innovation. Today’s leading businesses require seamless access to location, as it plays a vital role in a variety of their services and applications. Advances in connectivity, the internet of things, social networking and mobile devices are driving demand for cloud based location services. At the same time, the proliferation of affordable sensors is opening up new possibilities and new business models around location. We are entering a world where everything can be mapped and represented in multiple dimensions. Not only can places can be mapped with digital 3D abstractions, but the movement of people and objects can also be charted, providing a rich source of fresh data that brings the map to life.
As the only pure play location company with global reach in the market today, HERE is in a prime position to take advantage of these trends in location. HERE is building on our foundation as the leading map content company to become the leading location cloud company. Our ambition is to reinvent the map, making it the prime source of location intelligence for businesses across industries, capable of providing fresh, predictive and highly contextual answers for every question.
For example, our Enterprise business at HERE helps companies and organizations understand and analyze their operations and assets using our location data and tools. With an advanced understanding of both their mobile and fixed assets, companies can gain new insights into their businesses that help them boost productivity and efficiency. The result is a better top-line and bottom-line for our customers.