
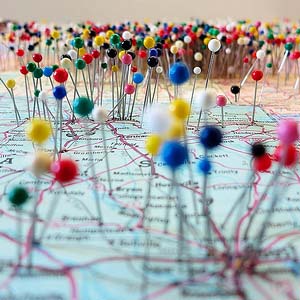
 News reporting has taken a new dimension, the shift now tending towards information/news mapping. Light weight Geo-apps now incorporate great and easy-to-use functionalities helping folks in news reporting geo-tag news to where it is happening or has happened on map.
Courtesy of StreetFight Magazine.com, the following Geo-apps have wonderful functionalities enabling reporters pin disparate formats of information ( texts, photos, videos, sounds etc ) on map and quickly make it available for the public on the web.
Have fun as you explore the following.
1. PointsMentioned: Automate the map-making process.
PointsMentioned is a tool that reporters can use to quickly create maps to go along with their online stories. PointsMentioned uses “natural language processing” to automatically identify addresses, cross-streets, and specific sites mentioned in articles, and then generates maps based on those geocoded locations. (Reporters can add additional points manually, as well.) Reporters and editors can embed the maps they create by inserting a few lines of code, and readers have the option to magnify and reposition these maps to fit their screens. PointsMentioned is available at a “very low price point to encourage publishers to give it a try.”
2. ZeeMaps: Quickly map a list of addresses.
ZeeMaps is a tool that journalists can use to quickly add hundreds, if not thousands, of location points to a single map. Users can import lists of data points in multiple formats (including CSV and Excel), and ZeeMaps will automatically geocode the addresses and place them on a map. Map pins can be customized to include photos, videos, audio, and outside links. Maps can then be embedded or turned into PDF or JPEG files. Reporters have the option to let readers manually add entries to their maps, and they can use varying marker colors to delineate which points have been added by readers and which have been added by the publication. Pricing for ZeeMaps ranges from free to $102 per year.
3. Google Maps: Illustrate a story with a straightforward map.
Journalists who are used to using Google Maps to look up driving directions and locate nearby businesses should be comfortable using the free tool to create their own maps with relatively little training. Reporters can manually add an unlimited number of pins to the maps they create, and they can customize the information that pops up when readers click on specific pins to include links to related stories, photos, or descriptions. Publishers with more advanced needs can also utilize Google’s Maps Image API to embed maps without Javascript.
4. MapBox: Design custom maps to match your site’s aesthetics.
MapBox is a tool designed for publishers who want to give their maps a custom look. Using the platform (powered by OpenStreetMap), reporters can design maps with varying color schemes, terrain layers, and interactive markers. Users have the option to annotate their maps with pins, symbols, or “interactive tooltips,” and they can embed graphs or images that pop up when visitors click on certain points. Pricing for MapBox ranges from $5 per month (for up to 10,000 map views) to $499 per month (for up to 1 million map views).
5. CartoDB: Publish dynamically changing maps.
News stories are rarely static, and maps that don’t change as a story progresses can quickly start to feel stale. CartoDB offers a solution for this, providing a way for journalists to add context to their data and visualize trends from social networks like Instagram, Foursquare, Twitter, and Flickr. Publishers can also utilize event mapping to add context when filing multiple stories about ongoing news events. A site covering a local parade, for example, can place photos being sent in by readers on an interactive map. Publishers can also use maps to help readers visualize data-heavy stories, showing how droughts or economic patterns have changed in an area over time. CartoDB offers pricing plans that range from free to $149 per month.
6. MapQuest: Build custom interactive and static maps.
Publishers that want to use MapQuest maps on their websites have a few ways to make that happen. MapQuest offers a tool called Map Builder, which publishers can use to add specific locations to a map, customize how those location points should look, and draw shapes (to map routes or show a progression of events). These interactive maps can then be embedded, or uploaded as static maps. Publishers also have the option to use the Link to MapQuest tool to display interactive maps and driving directions, or to send any map they’ve created on MapQuest.com directly to their websites. MapQuest offers free tools for publishers.
7. Meograph: Create multimedia stories with maps.
Hyperlocal publishers can use Meograph to quickly and cheaply create multimedia stories that readers will want to share. Reporters can upload maps, videos, photos, and audio files to go along with the text from their stories, and the platform will turn those individual elements into an interactive, multimedia file that can be embedded on any site or shared via social media. Meograph encourages publishers to repurpose existing content, giving new life to day-old stories by adding various interactive elements that play on top of a digital map. Meograph’s core product is free for news organizations. The company plans on rolling out premium tools for journalists in the future, as well.
Source : StreetFight Magazine.com

#Business


Next article

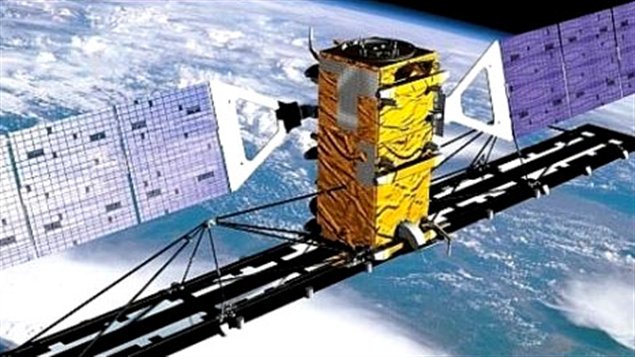
RADARSAT-1: An ailing Remote Sensing Hero
Canada’s first Earth Observation satellite “RadarSat-1”, launched in 1995 has been functioning for the last 18 years. It was widely recognized for its Synthetic Aperture Radar data.
In a news release late last month, the Canadian Space Agency had reported an anomaly had occurred. Michel Doyon, Manager of Flight operations, had expressed that the satellite may have been hit by space debris and is experiencing problems.
The problem has been identified as a power issue and the satellite had actually stopped communicating. Currently, the satellite has resumed communication and has been put in safe mode to ensure battery life. But looks unlikely that the satellite will be brought back to active service. Officially Dormant!
For 18 years, RadarSat-1 had been a great source of SAR data, helping researchers all over the world study climate change besides being a great source of remote sensing data for cartography and disaster management.
Ironically for a satellite that has been disturbed due to space debris, considering the orbit of RadarSat, it most certainly end up adding its name to the space debris list. Designed with a life expectancy of 5 years, RadarSat has contributed for a long time. Let’s just hope against hope it gets back online!
RADARSAT-1 definitely a remote sensing “SuperStar”.