
GIS has come a long way from its academic roots in the 1960’s, when computers were the size of rooms and geospatial data meant maps overlaid with mylar sheets. Today, GIS has become one of the most exciting realms in all of data science, with applications that are transforming our world.
It’s fair to say that the COVID-19 pandemic, for all its impact, would have been far worse were it not for the contact tracing, spread mitigation and logistics support made possible by geospatial analytics. Cellular data, mobile devices, IoT and other technologies have taken geospatial science to an even higher level of value.
As we look toward the future, artificial intelligence (AI) and machine learning (ML), as well as accelerated data processing based on parallel GPU and CPU configurations, will push GIS further. The ability to process and visualize billions of rows of data in milliseconds, a trait of accelerated geospatial analytics systems, is supporting everything from autonomous vehicle design to helping to solve the opioid crisis.
Modern GIS analytics is used for health research, commercial real estate, public safety, even national security. And the real possibilities are just beginning.
New use cases emerging
The ability to model geospatial data in real time has had a deep impact on data science. The discipline gains additional insight when disparate datasets, from a multitude of sources, are integrated.
COVID-19 vaccine deployment is a perfect example. Even after months of advanced planning, there were delays in vaccine deployment once the FDA granted its emergency use authorization. Logistics experts had to adjust in real-time to meet incredibly important distribution schedules. The combination of case count data, warehousing information, transport availability, traffic and weather, all played a role in solving shipping problems and removing bottlenecks.
There are endless applications for simultaneous integration of real-time data from public and private sources in the GIS sciences. ADS-B (Automatic Dependent Surveillance—Broadcast) data, when viewed alone, shows where commercial and non-commercial aircraft are flying in U.S. airspace at a given moment. ADS-B allows analysts to say, “Show me which planes are more than 50 miles off their typical flight path.” But simply by adding real-time weather data, new insights are unlocked. Users can quickly determine which aircraft are off their normal flight path due to a thunderstorm, for example, versus other potential causes.
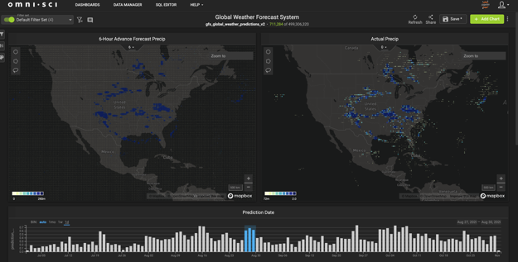
NOAA Global Forecast and Actual Precipitation
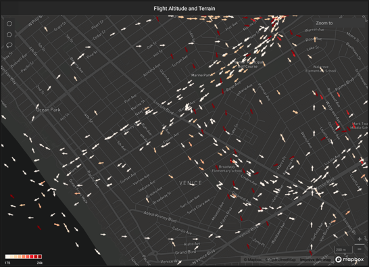
ADS-B Flight Patterns Over Los Angeles
Advanced spatiotemporal analytics—the study of movement over time in a particular geography—is answering questions for businesses as well. For retail stores, spatiotemporal analytics is used to identify patterns and anomalies in foot traffic outside, and even inside, a store. Merchants are able to look at when shoppers spend more or less time in front of a particular store display. They can then determine if there are patterns among customers, or groups of customers, that may prompt possible improvements in the layouts of stores, restaurants or entertainment venues.
In sales and marketing, different forms of data can be combined using spatiotemporal applications to generate targeted promotions and loyalty programs. Shopper movement data can be leveraged against customer purchase history to optimize real-time offers, promotions and product information. These notifications, delivered via a retailer app or other channel, can be timed for when the shopper is in the neighborhood or even as they move through different departments within a store.
Real-time analytics is also helping transportation dispatchers track trucks, ships, trains and other modes of transport. By cross-referencing traffic, weather, safety and emergency information, operators can optimize routes and minimize delivery delays.
Real-time data helps GIS practitioners supply insights faster so agile decision-making is the norm, not the exception. In many quarters, decision-makers are finding they no longer have months, days or even hours to plan their moves. Daily or weekly operational reports simply don’t fit the bill in our fast-paced, digital world. But with the ascendence of real-time information and advanced analytics platforms to process information, people are getting the immediate understanding they need.
Advances through AI/ML
Artificial intelligence and machine learning are changing the nature of geospatial analytics. ML technology is enabling image classification with significantly higher granularity; assessments of forest development and health, which not long ago was based on years-old 30-meter resolution from Landsat satellite data, can now be evaluated using ML-enhanced, 10-meter data from newer Sentinel-2 satellites updated weekly. AI is being used on high-resolution urban imagery to help with post-disaster assessments, urban planning, ad targeting and more. Several open source and commercial options are also available to perform image cleanup and ML data extraction on-demand.
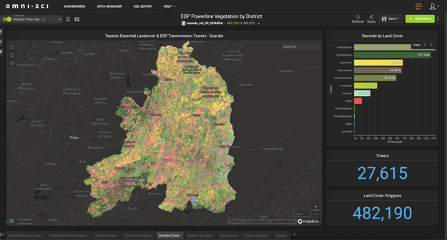
Data partner Tesselo 10m national land cover for Portugal from ML applied to Sentinel-2
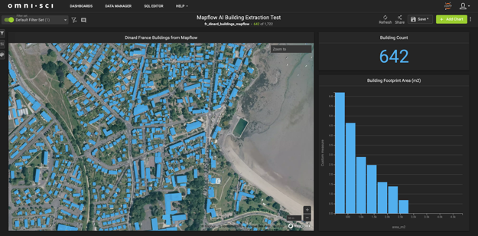
Building footprints for Dinard, France from MapFlow.AI on demand web service.
On another front, Discrete Global Grids (DGGs) are seeing new life. DGGs are not new, but they are being energized by Placekey, an open-source initiative, to eventually give every physical place on the planet a unique identifier. Placekey includes a “where” and a “what”; the “where is encoded using the H3 DGG system from the Uber, the ride-sharing company. This, along with other programs, is making DGGs more useful in GIS analysis.
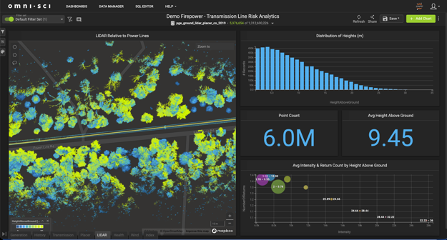
Cyclomedia Ground LIDAR data (1.3B points) for power line vegetation management
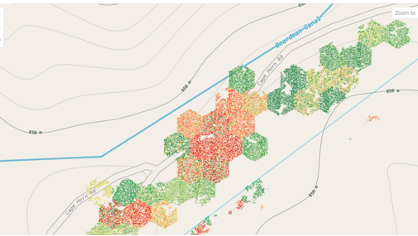
A “Stike Tree” risk model integrating LIDAR, vegetation health and wind data using Uber’s h3 discrete global grid
Soon the long-awaited concept of digital twinning will become a reality as well. GIS is fast becoming a pursuit in which data is not based on class abstractions, but on real-world objects of extremely fine granularity. Utilities, for example, are beginning to model and monitor individual trees around their powerlines for potential strike and fire risk. Telecommunications providers are measuring signal interference from buildings and vegetation with one-meter resolution. Knowing what is going on around critical assets is increasingly important—and modern technology stacks are automating the construction of these virtual doppelgangers.
Speed of curiosity
When organizations have the ability to quickly and interactively interrogate their geospatial and spatiotemporal data in real-time, the game changes. Practitioners can work at the speed of their natural curiosity, asking and answering questions as quickly as they can come up with them. New forms of inquiry emerge, science advances, and all sorts of seemingly intractable problems suddenly have a path to resolution.
Advanced analytics tools, combined with a growing ecosystem of real-time data from thousands of sources, are driving this GIS revolution. It’s a rich, multi-dimensional world we live in—and real-time geospatial analytics is helping us comprehend it, one data point at a time.


#Business


Next article

By Peter Agenga of Map Kibera
This post has been cross-posted from Map Kibera.
2020 has been a unique year owing to the fact that the whole world was brought to a stand-still by a global pandemic. Kibera and other informal settlements of Nairobi weren’t spared either. Most of the Kibera residents work as casual labourers and due to the regulations set up by the government, the majority of the residents lost their jobs while some had to shut down their business. This left most of them having to rely on well wishers for any form of support.
In response to this, many organizations came up with initiatives to support the community; this varied from sensitization activities, food and soap distributions, setting up hand wash points and other relevant resources. Map Kibera, having worked with these organizations in other events and activities, partnered with them to:
- Map out their activities and post them on the Ushahidi-based Kenya Covid-19 tracker; this included training them on how to post their work and offering support in posting them where necessary.
- Directly support the programmes they were implementing on the ground.

A group photo with representatives of different organizations in Mathare
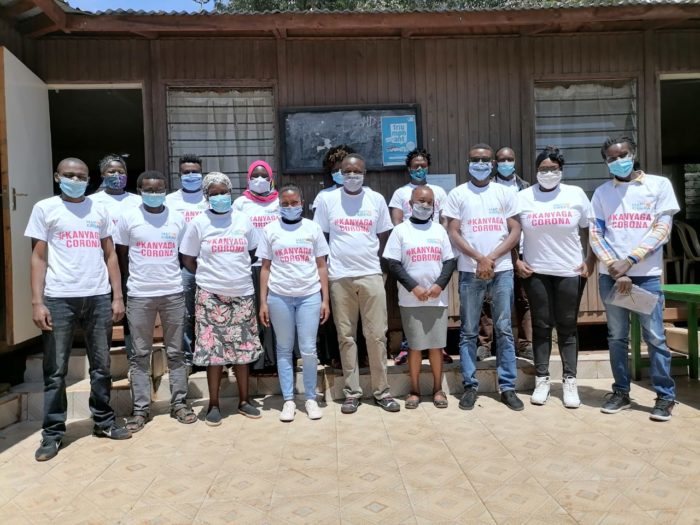
A group photo with representatives of different organizations in Kiber
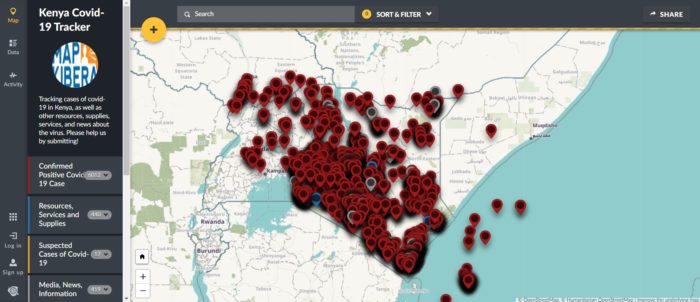
Mid this year Map Kibera was awarded the 2020 Rapid response Micro-grant funds by Humanitarian OpenStreetMap Team (HOT) to support our Ushahidi deployment. We created the site for tracking Covid-19 cases, resources and news related to Covid-19 —primarily in Kibera as well as the other informal settlements of Nairobi, but also other parts of country. The goal was to keep this information together in one easy place, allowing people to see what is going on around them that might be relevant to them. This was also to aid in our efforts to keep Kibera, one of the most vulnerable communities to illness, healthy during this pandemic.

Joshua doing a live demo of how the Kenya Covid Tracker platform works
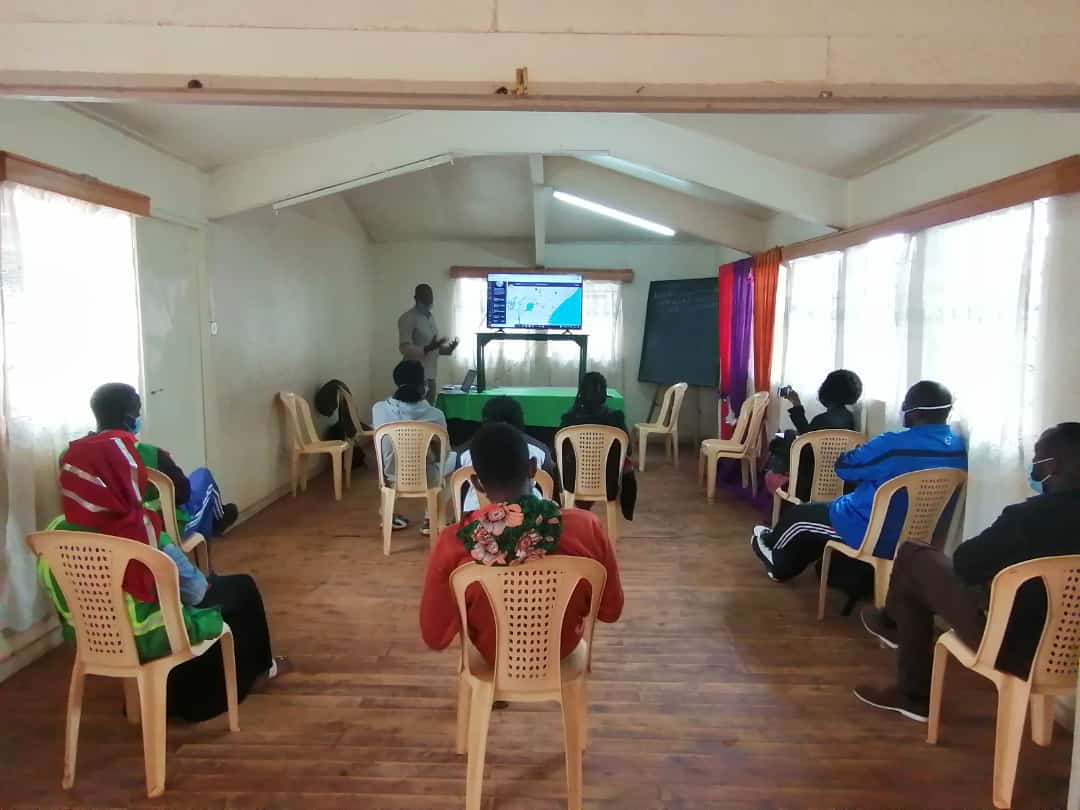
Joshua introducing the project to the team from different organizations in Kibera
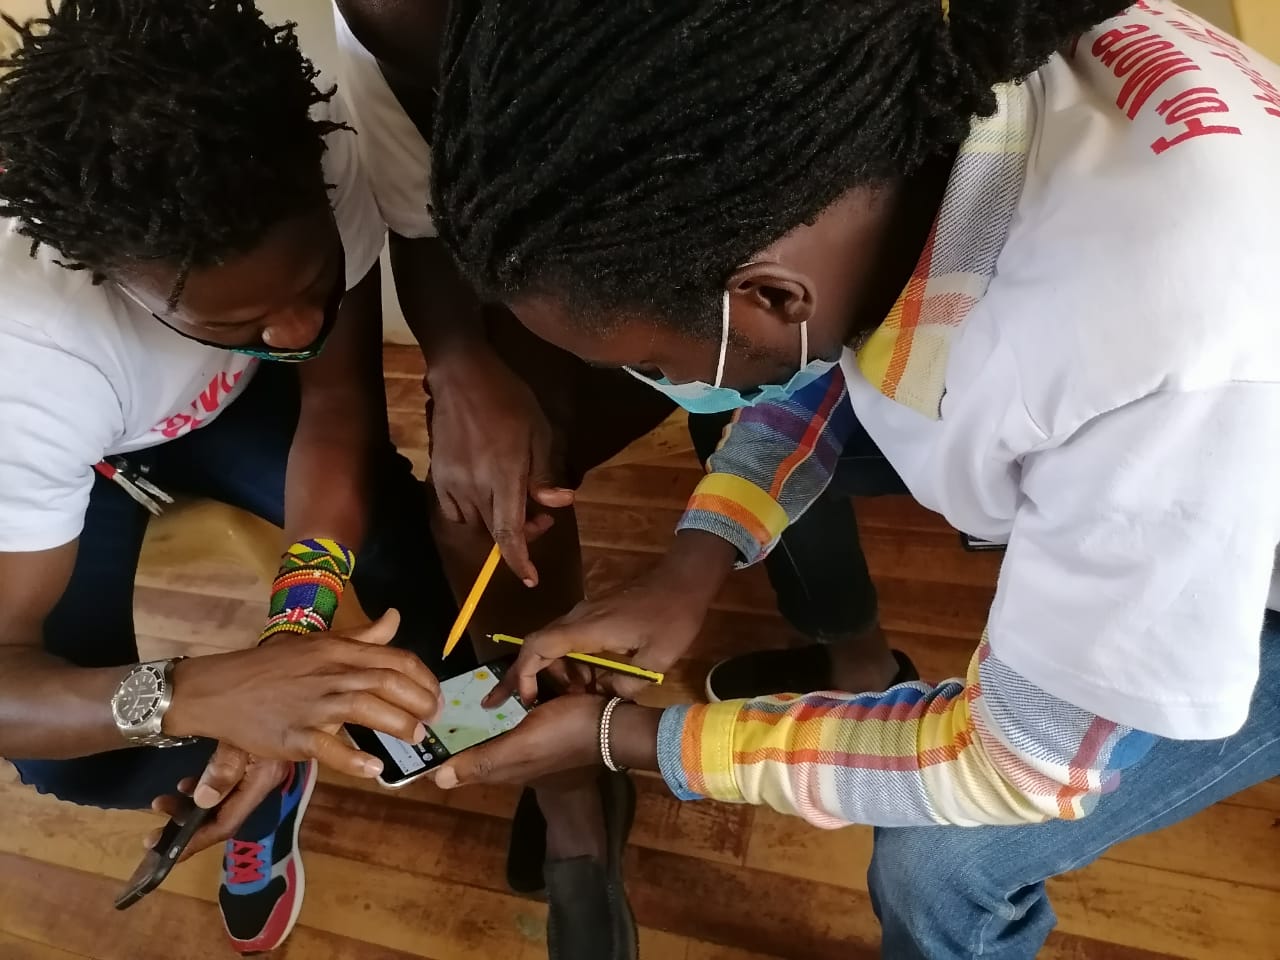
Some of the participants testing how to add posts on the Ushahidi platform using their mobile phones
The team had already started working remotely, and therefore made use of the online tools for accomplishing the mapping tasks involved in the project. The team used tools like Maps.Me, healthsites.io, and of course OpenStreetMap to work on all the mapping tasks that were agreed upon. The initial training was conducted in form of webinars through Zoom and Google Meet; this was because of government directives on safe distancing to prevent the spread of the coronavirus. As the tools mentioned above suggest, the goals of the mapping activity were the following:
- To train community volunteers on how to add and edit information remotely on OpenStreetMap
- To ensure timely and accurate health data on OpenStreetMap
- To improve coverage of maps on health in the country (especially on informal-settlements)

Screenshot of one of the webinars we hosted
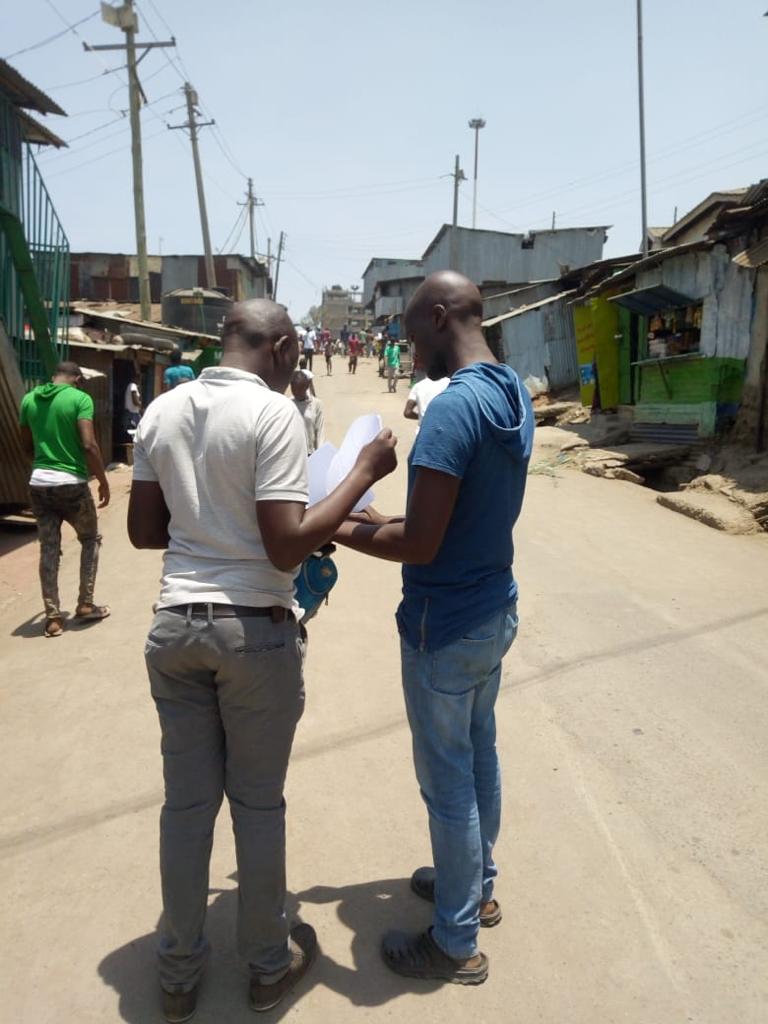
Our team members from Mathare while on the field to cross-check and verify the data that was imported and checking for any extra information that was not captured
We also have recently trained more community ambassadors on the use of various mapping platforms that are freely available and accessible to the public. This wouldn’t be easy to achieve without the financial and moral support from HOT and all the parties that were involved in the Micro-grant Program.
Update: Map Kibera is currently doing an update of WASH data in Kibera and Mathare and at the same time running a survey of how the two communities coped with the issues of water and sanitation during the pandemic.