
The human mind is wired to observe variance in visual gradients, something that can be commonly observed with density or weather maps. Sensory processing is something that all people innately have, though in some instances there is unique variability such as in cases ranging from synthesia to autism. Being able to appeal to the learning capabilities of this variance can lead to greater potential for these individuals.
There are potential ways to involve a student group that encompass the spectrum of sensory processing capabilities with what they’re learning; approaching maps, geography and associated data could be made simpler when converting points and charts of data into more simplistic color gradients. Challenging students to create their own abstract gradients allows for a nominal first interaction that makes this relatively complex subject far more approachable for a greater variety of learners.

What is the science behind this approach to map data and data sets? Early multisensory convergence, something observed in mammals in The Journal of Neuroscience, could play a significant role in the introduction of this in geography. Fostering an environment that appeals to multisensory categories could potentially influence and increase the capabilities of learners to better utilize information provided by visual input for a greater duration of time.
In a separate MRI study performed by Bell Laboratories to map brain activity when presented with visual stimulation, the concept of signal changing influencing accompanied sensory stimulation showed a detectable transient increase in water proton magnetic resonance signals in the human primary visual cortex.
The greater intensity of visual interest over time, the greater onset of visual cortex stimulation. In a more simplistic sense, providing a more visually complex method to observe geographic data could in turn produce similar results of interaction, potentially leading to better student interaction with materials.
Allowing individuals to interact with geographic data on a level that is best suited to their individual capabilities regarding processing sensory input may foster not only an environment more conducive to learning, but an environment that fosters creativity. This is something that fields of study regarding science and technology can lack for those with potential to learn the subject but require a different approach to provided information.


#Ideas


Next article

Uber is a great example of a company that has built an incredible business using the core competencies of GIS at the backend and a very straightforward and intuitive UX. Their business models and other aspects of their business are up for debate but its hard to deny that they have an amazing user interface (and a great design team to thank for that).
Uber and Maps
Uber has been using maps since their inception for a wide variety of applications ranging from visualization your uber ride on the map, to helping cities understand traffic patterns better, to map road conditions.
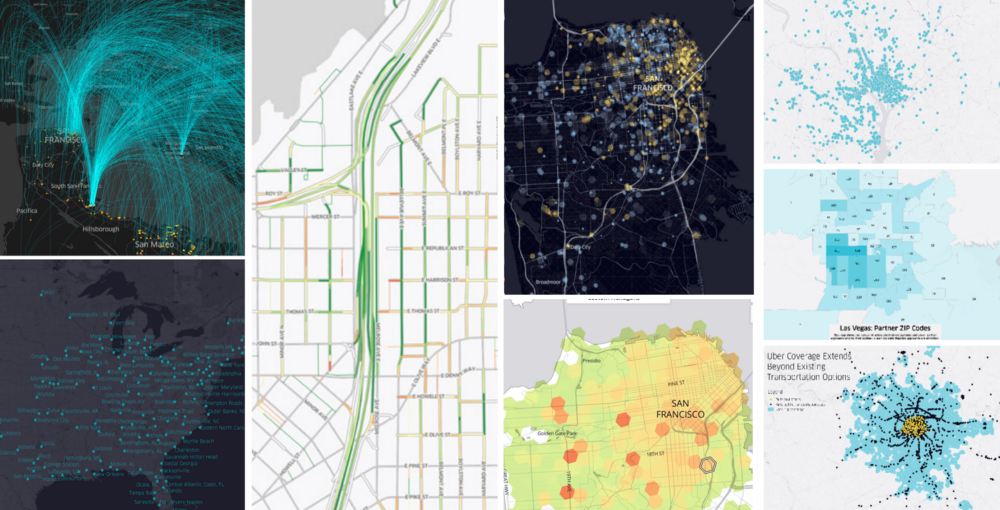
“Many teams, many maps” – A collage of maps created at Uber in 2016. Image Copyright Uber Design
But how does a company like Uber approach mapping & visualization? Do they have a unified outlook towards Cartography or is it more tuned towards the application? What tools do they use?
Erik, the lead of the Data Design Team at Uber, wrote an engaging blog post on “Crafting Data-Driven Maps” that answers all of these questions and more! It’s totally worth your time – do check it out.
https://medium.com/uber-design/crafting-data-driven-maps-b0835b620554