
As high-fidelity sensors continue to become smaller and more compact, drones are now capable of carrying more payload options than ever before. With all these various models, picking the right one for each unique industrial use can feel overwhelming.
The best way to begin is to identify your specific needs by first determining the result that you want. What are you hoping to achieve? Once you have established your goals, selecting the best-suited sensor will come easily.
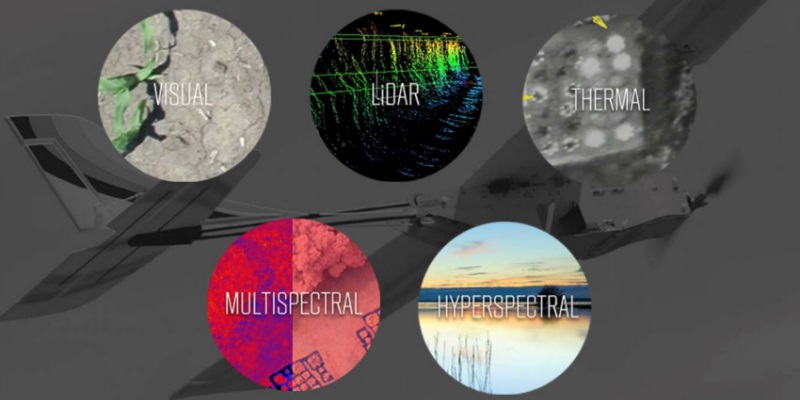
At PrecisionHawk, we are cognizant of the fact that better aerial information is highly dependent on the quality of data coming into the pipeline. For this reason, we offer a wide range of sensors and comprehensive data analysis tools that are unparalleled in today’s UAV market. Below is a brief overview of each sensor available, its industry applications and use cases.
The Sensor Applications Matrix is an easy-to-use guide that simplifies sensor selection for your industry needs. It represents a sampling of top drone applications, though the possibilities are virtually limitless. Click on the image to enhance.

Hyperspectral
The completely integrated visible and near infrared Hyperspectral Sensor is perfect for small UAV applications. Hyperspectral provides more detailed information content with a capability to see the unseen in comparison to a visual camera. The line scanning (push broom) type sensor is perfect for research applications to measure the spectrography of the ground.
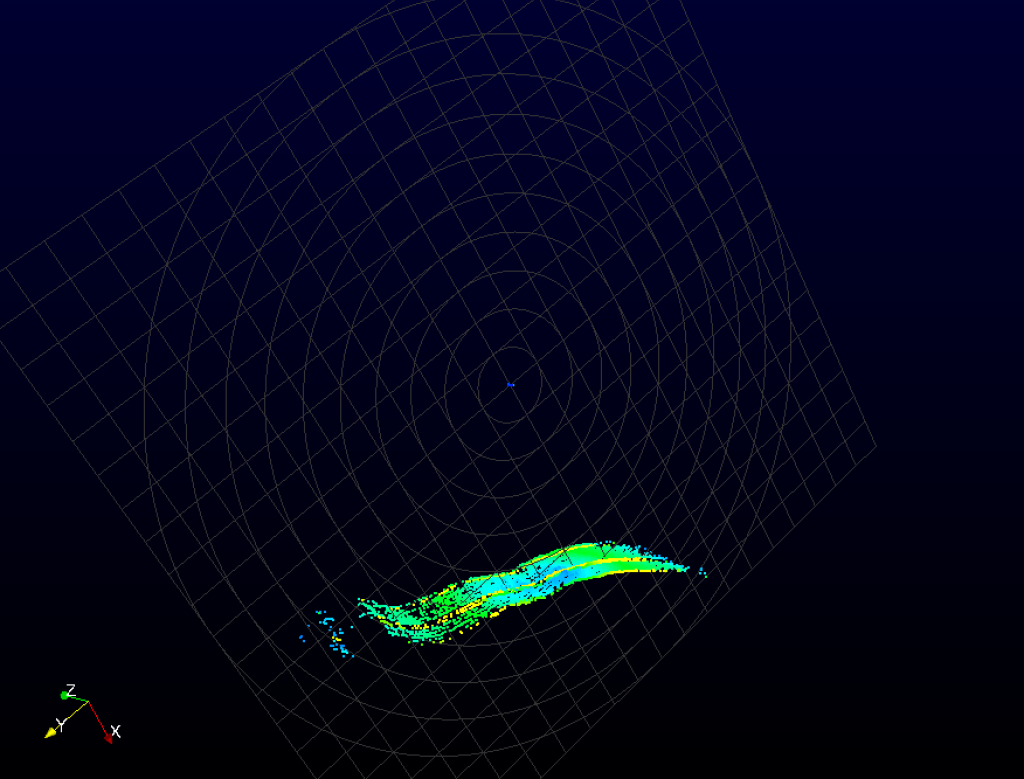
LiDAR
LiDAR is a more traditional surveying tool used for creating point clouds and digital elevation models of the ground. The data can be used for plant height measurement by comparing the first return from the laser when it hits the top of the plant to the last return when it hits the ground.The ability to penetrate foliage makes LiDAR unique compared to passive optical imagers that provide height data only from the canopy. The digital elevation models can be more accurate compared to visual sensor based digital elevation models, depending on the application.
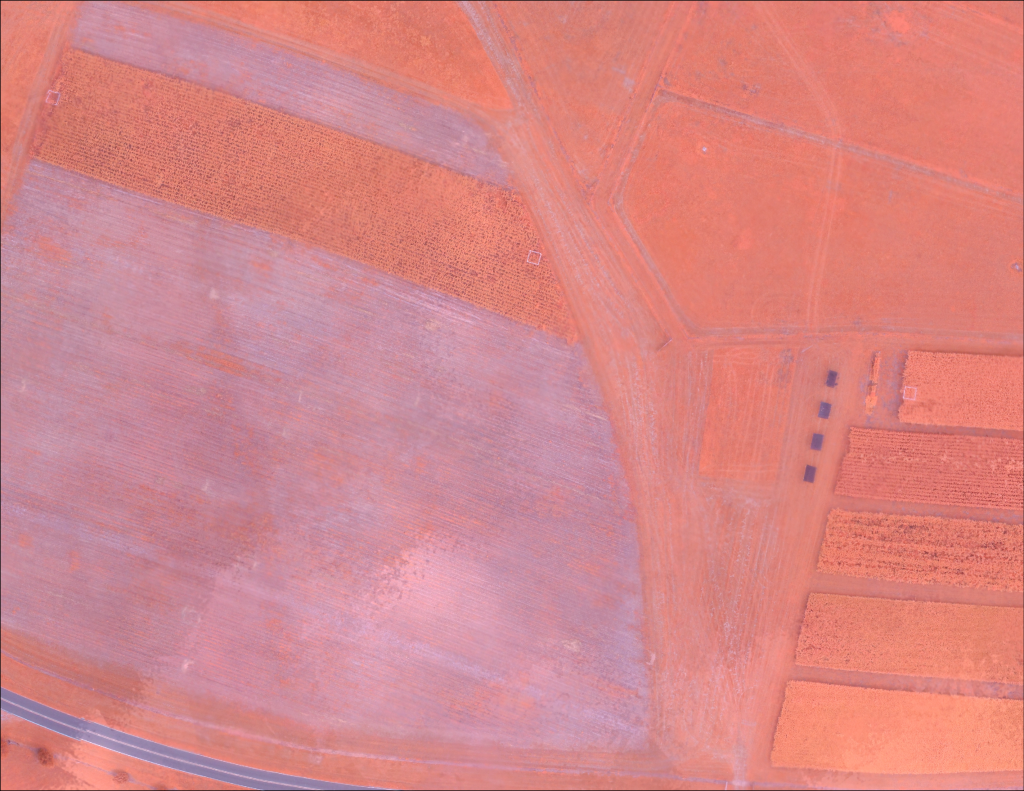
Multispectral
The Multispectral Sensor is one of the most commonly used scanning systems. Like the Hyperspectral Sensor it’s able to see visible light, infrared radiation and ultraviolet light. We offer a 5 Channel Multispectral Sensor and a High Resolution Multispectral Imager. They range in the number of bands and resolutions, topping out at sub one centimeter per pixel.
Thermal Infrared (TIR)
Thermal Infrared Sensors have the ability to measure and read the surface temperature of land or objects beyond the scope of human vision. We offer two Thermal Infrared Sensor options, a High Resolution TIR-H and Radiometric High Resolution Thermal Sensor. Although the two sensors are very similar, a key difference is the High Resolution TIR-H sensor output is linear with temperature.
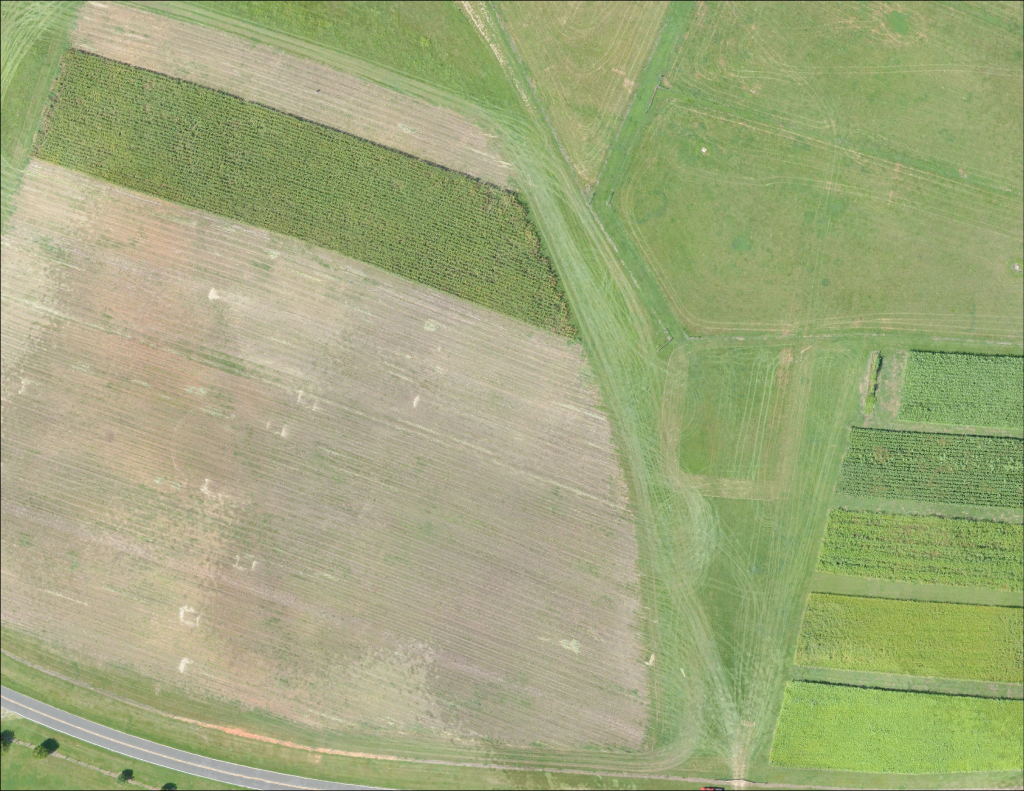
Visual
Both the Visual Sensor and Enhanced Resolution Visual Sensor are high-resolution, low-distortion RGB cameras which produces color imagery. A major advantage of visual imagery captured by a UAV is the aerial perspective of a specific area. You’re able to get a birds-eye-view high-res picture without putting in extra effort for the vantage point.
In a results driven climate, having a multitude of solutions available in one location eases the pressure when selecting the perfect sensor. We are constantly exploring advancements with the range of sensors we currently offer and creating innovative solutions to add more sensors to our existing line.


#


Next article

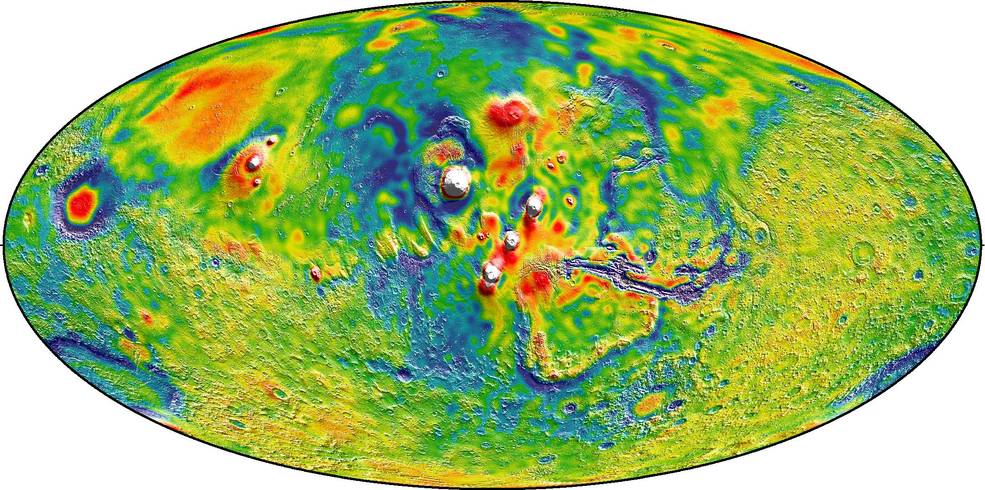
The Martian gravity map is the buzz of the space world. NASA has released the most accurate gravity map of the red planet paving a way to peek into the it’s interior properties of the planet.
“Gravity maps allow us to see inside a planet, just as a doctor uses an X-ray to see inside a patient,” said Antonio Genova of the Massachusetts Institute of Technology (MIT), Cambridge, Massachusetts. The Doppler and range tracking data collected by NASA’s Deep Space Network from three of NASA’s spacecraft orbiting around Mars – Mars Global Surveyor (1996), Mars Odyssey (2001) and Mars Reconnaissance Orbiter (2005) for more than 16 years were utilised for the creation of the high-resolution Mars Gravitational Chart.
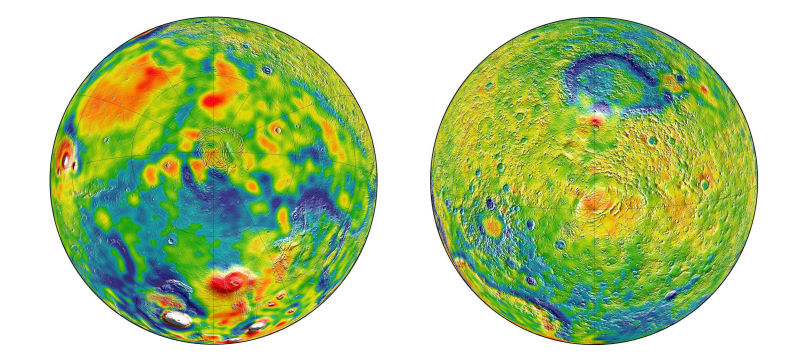
White and Red indicates the areas of higher gravity, Blue indicates areas of lower of gravity of North and South poles respectively.
The process behind the mapping of gravity anomaly involved the precise plotting of Gravity fluctuations experienced by the spacecraft as they orbit around the planet. Like all planets, Mars is lumpy, which causes the gravitational pull felt by the spacecraft to change. For instance, NASA explained, Mars’ gravitational pull is slightly stronger over mountains than over valleys, and changes when close to craters and other prominent features. The impact of Sunlight on Orbiting Solar Panels and also the pull from the thin upper atmosphere contribute to the change in trajectory of the spacecraft. Delicate analysis and computer modelling were performed for almost two initial years to filter fluctuations not caused by gravity.
The improved resolution of the anomalies 62miles (100KM) suggests a new explanation for how some features formed across the boundary that divides the relatively smooth northern lowlands from heavily cratered southern highlands. Also, the team confirmed that Mars has a liquid outer core of molten rock by analysing tides in the Martian crust and mantle caused by the gravitational pull of the sun and the two moons of Mars with a resolution of 75miles (120KM).
By observing how Mars’ gravity changed over 11 years – the period of an entire cycle of solar activity, the team inferred the massive amount of carbon dioxide 3 to 4 trillion i.e., 12 to 16 percent of the entire atmosphere – that freezes onto a Martian polar ice cap when it experiences winter. They also observed how that mass moves between the South Pole and the North Pole with the change of season in each hemisphere.
With these new findings and confirmations Earth is moving closer to its closest neighbour, via NASA.
[youtube https://www.youtube.com/watch?v=iDTDNIh4Qhw]