
Britain’s National Air Traffic Services (NATS) are responsible for handling much of the air traffic control in Great Britain and elsewhere. The most business airports are around London.
NATS handles over 2 million flights in UK airspace every year. Of those, over 1.2 million arrive at or depart from one of the five main London airports. That’s over 3,000 flights every day using just six runways. And 99.8% of flights experience no ATC related delay.
The organization created a really cool visualization to make understand how their typical day looks like. The video show ever flight starting or finishing in London over the course of 24 hours. Each airport gets its own colour. The effect is amazing:
source: Daily Mail

#Business


Next article

GIS Cloud as a combination of tools that adapts to your workflow, infiltrates a various number of industries. We have been presenting you use cases that cover different fields of expertise so you can get a better overview of our user success stories and how they utilize and adapt our solutions.
This particular use case is covering a Real Estate GIS scenario, where our users Providence Group answered couple of questions on their experience in using GIS Cloud apps.
BACKGROUND
The Providence Group offers a wide variety of commercial real estate services including brokerage, property management, development and corporate services.
With a primary focus on retail, the company actively represents clients throughout the Carolinas and strives to provide an efficient, dedicated and innovative level of service and support to all of its customers.
CHALLENGE
GIS CLOUD: What was the biggest challenge when it came to achieving your projects?
PROVIDENCE: We wanted to display our own PostGIS database and file geodatabase on a cloud provider so that we would be able to put the mapping power and research in the hands of our clients. Also the Google Maps Tile Map Service (TMS) is crucial for us and hard to find in most of the other cloud GIS solution providers. That was one of the crucial features for our users.
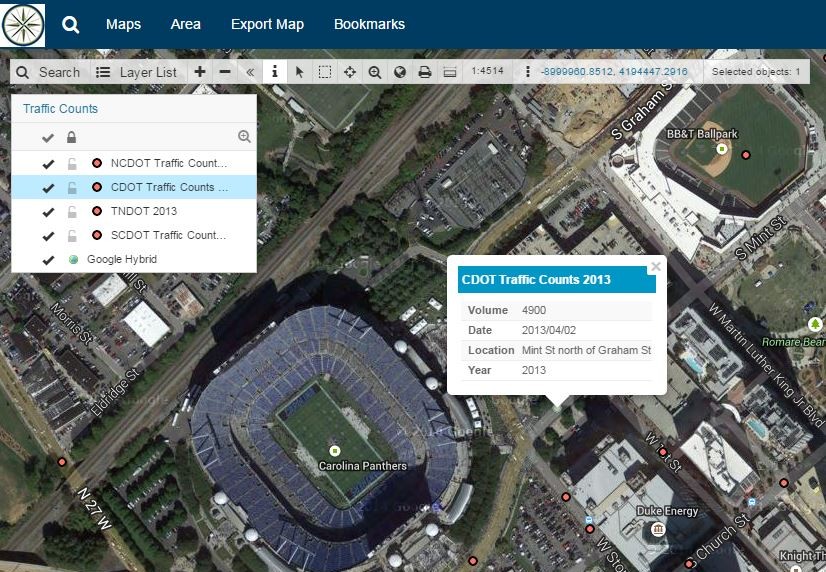
Traffic Count Viewer: showing how many cars pass a given site a day
SOLUTION
GIS CLOUD: Can you describe us your project workflow once you deployed GC apps?
PROVIDENCE: Once we deployed GIS Cloud we have successfully been displaying our own PostGIS database and file geodatabase on GIS Cloud. Instead of constantly having to update static maps, the user can create their own maps from our White Labeled Map Portal and Map Viewer, which saves a lot of time.
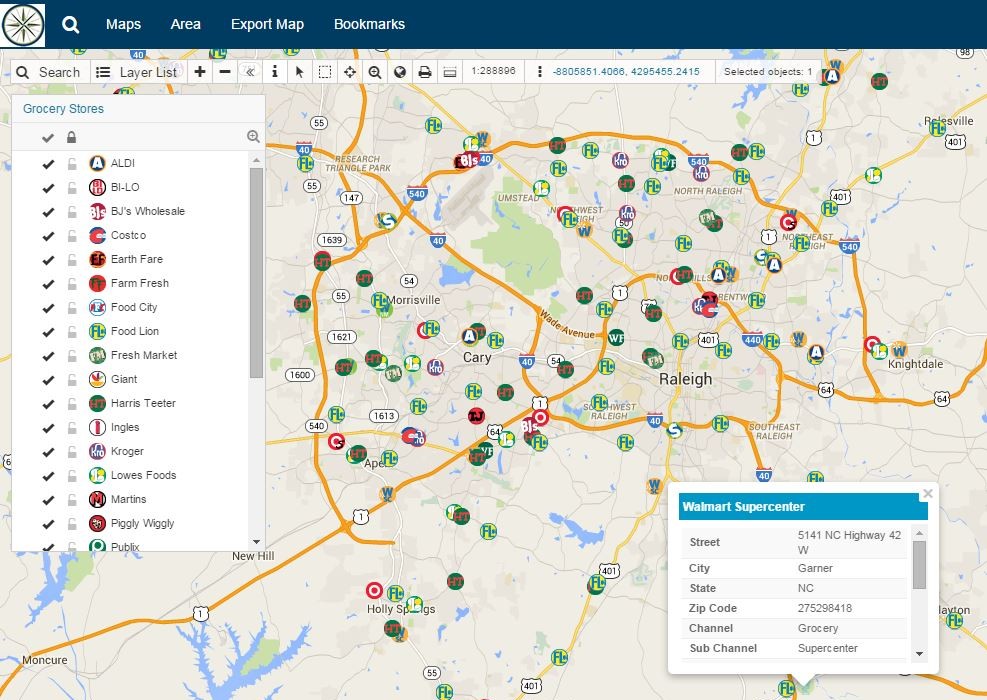
PostGIS Retailer database: used for competition maps and research.
Additionally competition, demographic and different typed of analysis like buffering, heat maps, trade areas, drive times and so on, are all used for site selection and location analytics in commercial real estate. All of these can be created on your Desktop using Map Editor app.
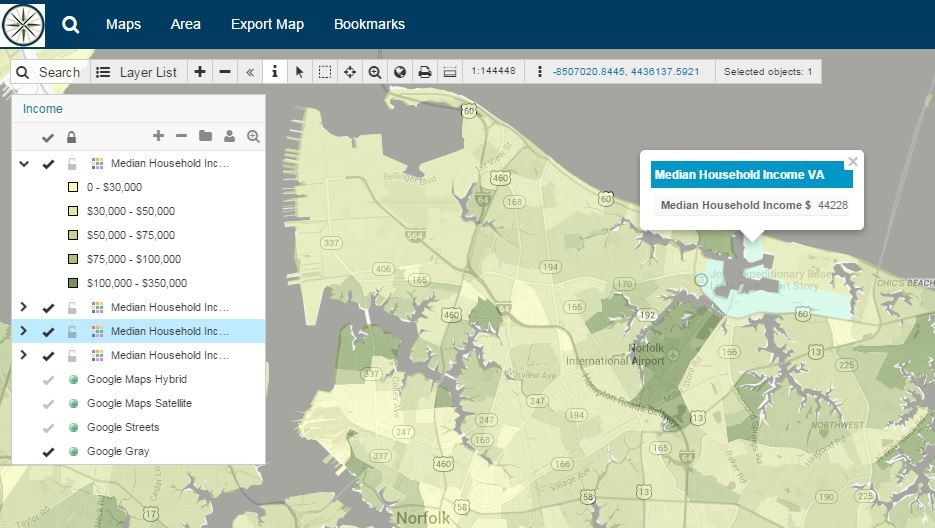
Median Household Income overlaid on the Norfolk-Virginia Beach area.
RECOMMENDATION
GIS CLOUD: What would be 3 key features in your opinion that you would recommend GIS Cloud for?
PROVIDENCE:
- Database Connectivity
- The numerous Symbology Options
- You can upload your own
- GIS Cloud Arc Publisher Extension that saves symbology from your ESRI shapefiles
- Tile Map Services
Originally published on GIS Cloud blog.