
Every GeoGeek knows the Urban Canyon phenomena that affects GPS signal in the cities with narrow streets and high buildings. But the fact that cities are growing up influences also the amount of sun that reaches the street level. New York Times has recently published an amazing map which is a comprehensive shadow study of NYC.
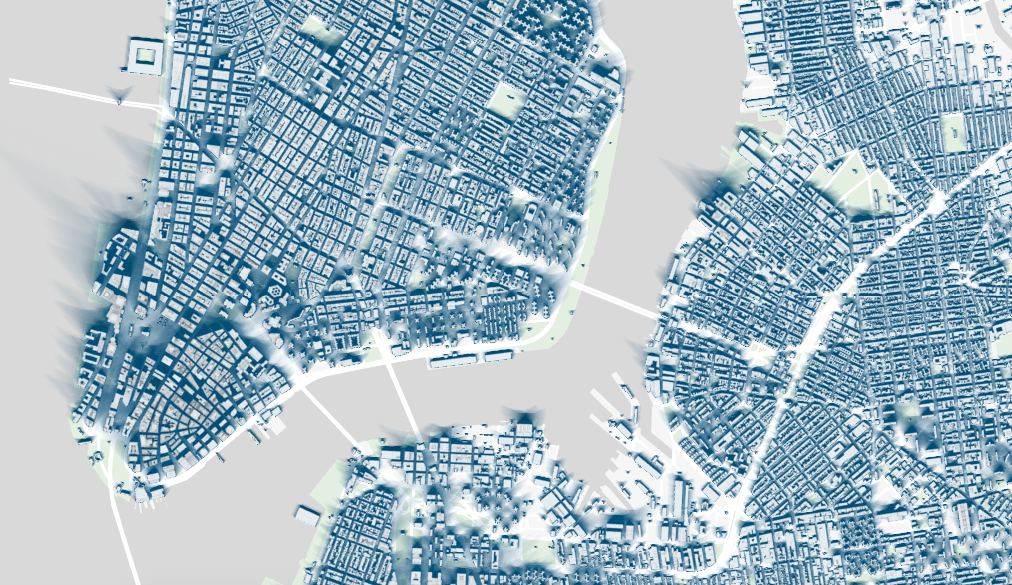
The map has three layers with the city’s shadow profiles: Winter, Summer and Spring/fall each of them based on data from Dec. 21 (the winter solstice), June 21 (the summer solstice) and Sept. 22 (the autumnal equinox).
When you look at it on the macro scale you will see the extraordinary piece of mapping. But the real fun and value of project begins when you zoom in…

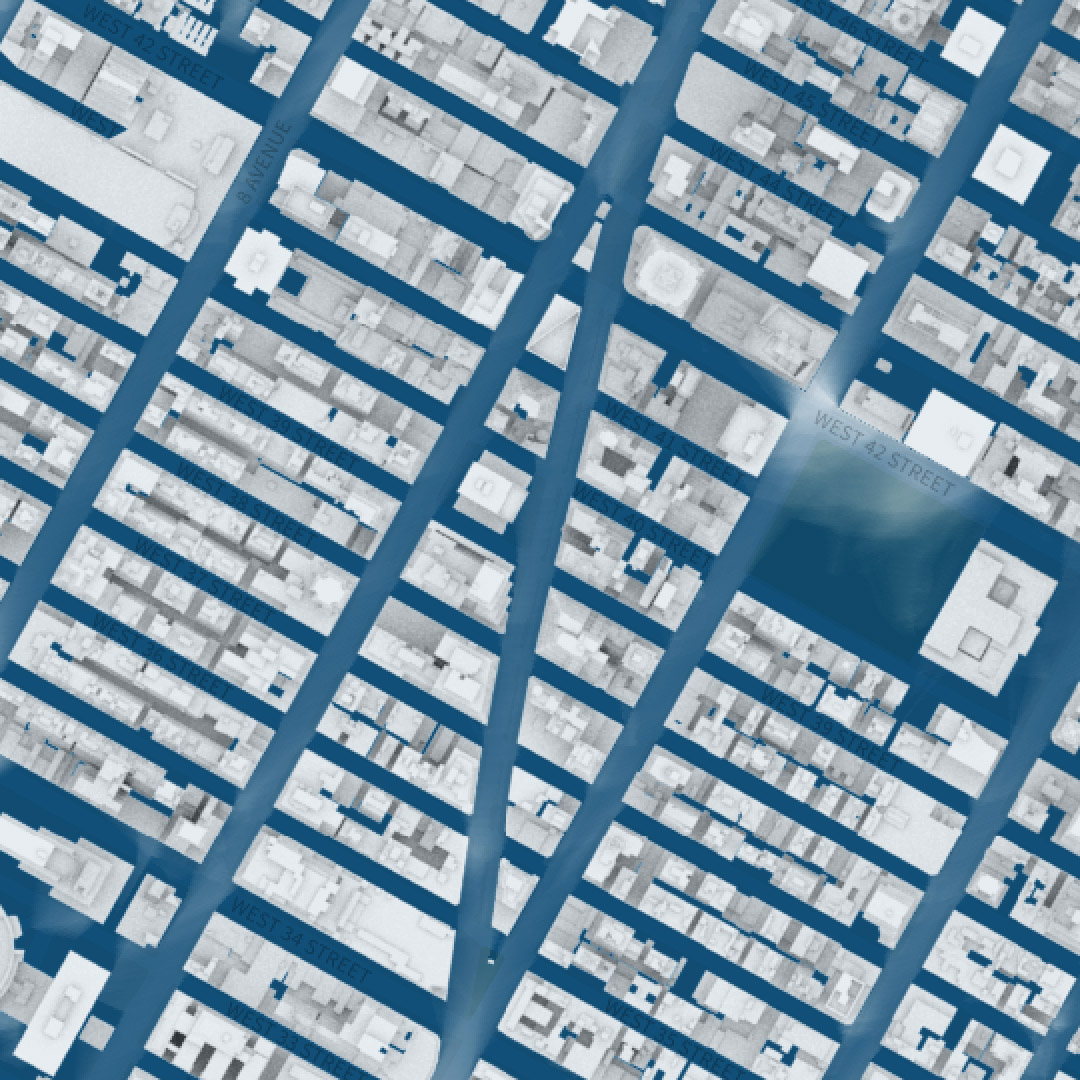

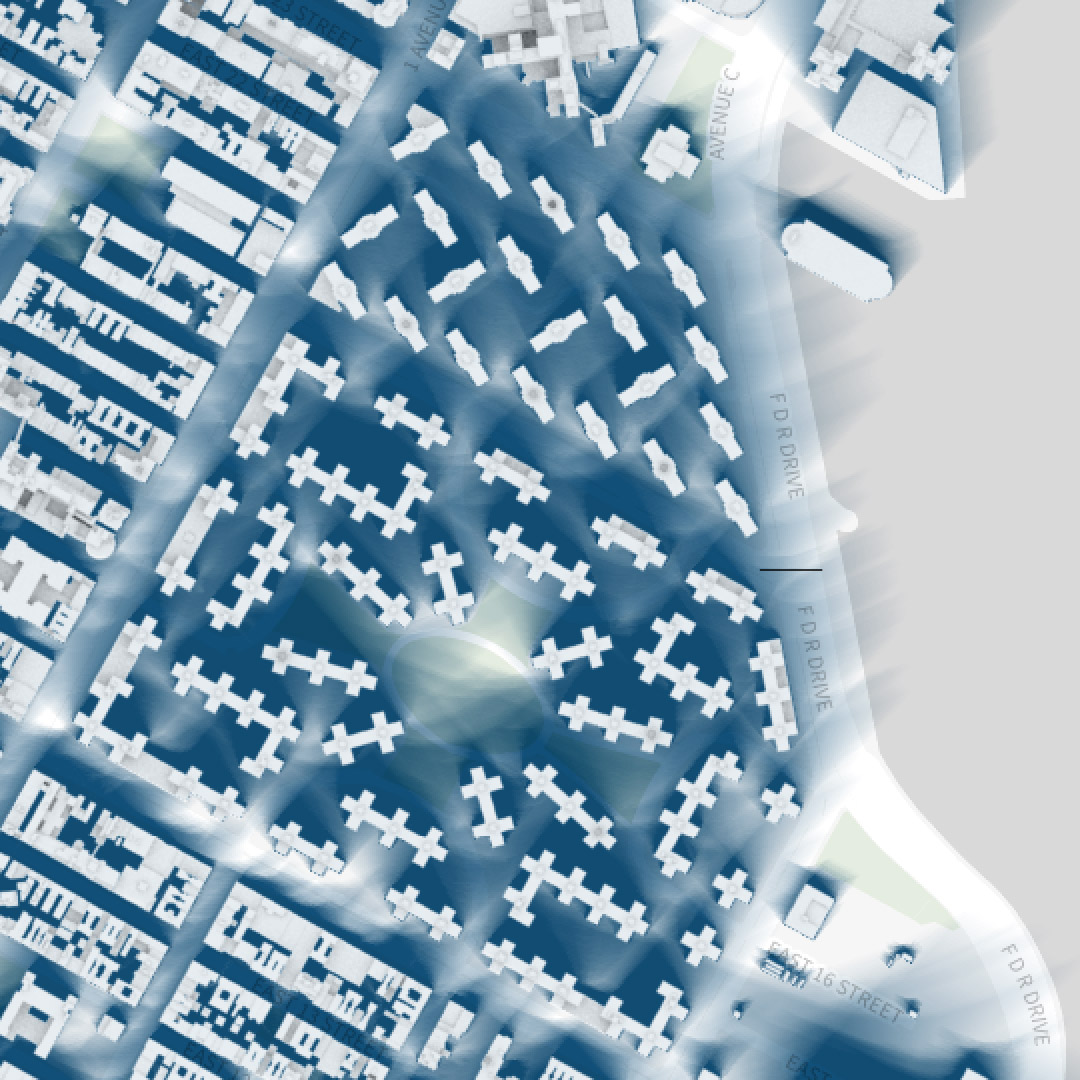
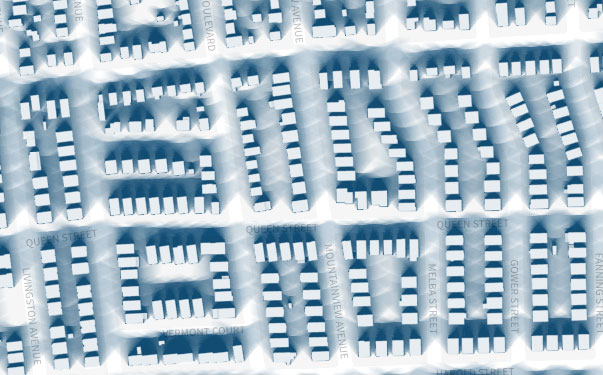
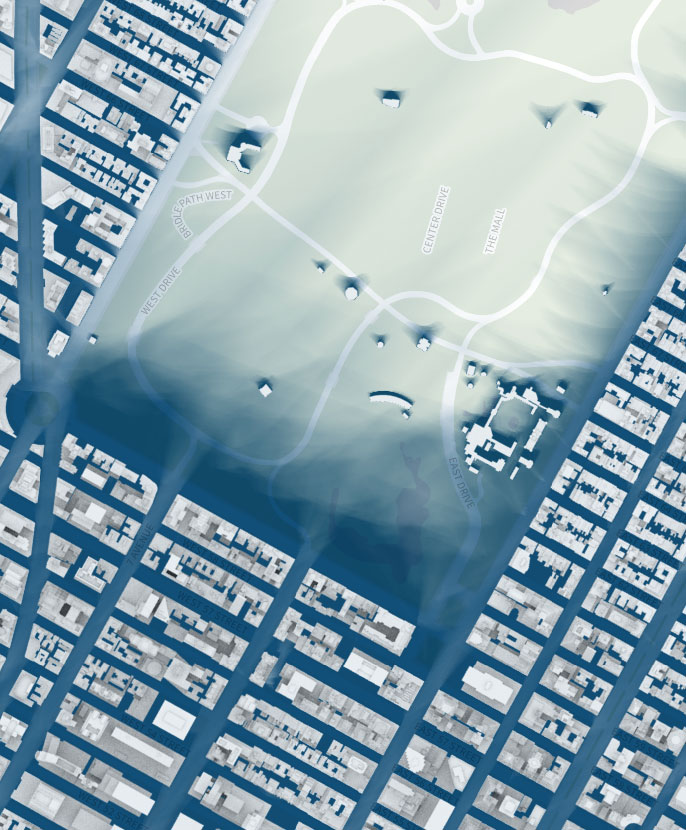
The study shows that most of the Manhattan areas will remain in shadow for at least half of daylight hours. The tool allows you to look into your neighbourhood and assess its lighting conditions and the amount of sunlight can affect things like the foot traffic patterns and apartment rental prices.
Amazing project!

#Ideas


Next article
TED (Technology, Entertainment, Design) is an amazing initiative that organizes events where inspiring people share their inspiring research, work and ideas. For the upcoming holidays we’ve rounded up 20 of the most inspirational and interesting TED talks about maps and geography out there. No matthew if you want it or not watching YouTube videos will most likely end up in your Christmas break’s agenda. This compilation will make it not a total waste of time.
1. Hans Rosling: The best stats you’ve ever seen
2. Rohini Swaminathan – There is nothing natural about disaster (Rohini is one of our Geoawesome authors)
3. Aris Venetikidis: Making sense of maps
4. Daniele Quercia: Happy maps
5. Eric Sanderson: New York – before the City
6. Parag Khanna maps the future of countries
7. Frederic Kaplan: How I built an information time machine
8. Dan Berkenstock: The world is one big dataset. Now, how to photograph it …
9. Ben Wellington: How we found the worst place to park in New York City — using big data
10. Steven Johnson: A guided tour of the Ghost Map
11. Blaise Aguera y Arcas demos augmented-reality maps
12. Stephen Lawler: Look! Up in the sky! It’s Virtual Earth!
13. Eric Berlow and Sean Gourley: Mapping ideas worth spreading
14. Dave Troy: Social maps that reveal a city’s intersections — and separations
15. Parag Khanna: How megacities are changing the map of the world
16. Allan Jones: A map of the brain
17. Lalitesh Katragadda: Making maps to fight disaster, build economies
18. Derek Sivers: Weird, or just different?
19. Greg Asner: Ecology from the air
20. Danny Dorling: Imagining the world anew – redrawing the world map