
Triggered by my interest in remote sensing I have come across the phrase agricultural modelling several times. I perceived the term, but actually did not have a clear idea of what it was about, of its scope, applied methodology and the link to remote sensing. Thus, for me the phrase was a buzzword, and that is why I decided to fill this information gap, in order to strengthen my ideas when mentioned notion is under discussion. I now want to share some of the information I found with you:
Agricultural Modelling
It is well known that remote sensing delivers information on vegetation. Widely applied information packages are vegetation indices extracting information of various spectral reflectances of canopy such as Normalized Vegetation Difference Index (NDVI) that replicates the surface’s biomass (thus also vegetation types) and if observed over a longer time the vegetation dynamics. NDVI is widely used for vegetation assessment, though it has some shortcomings and is exposed to contaminations from other sources. Canopy reflectance models are another choice to derive key vegetation variables such as leaf area, degree of maturity, plant density, content of brown leaves, content of chlorophyll and plant available water (*). Those data can be derived from satellite imagery.
Crop parameters
Canopy cover (Blue: 0% cover, Red: 100% cover) based on LIDAR data. Source: Andersen et al., 2005.
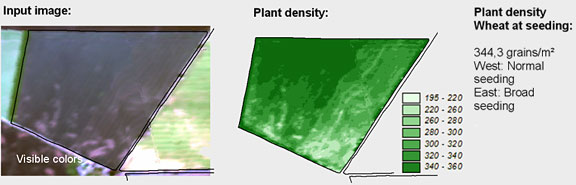
Plant density in a wheat crop. Source: Vista GmbH
Plant growth models
The great number of vegetation indices and canopy reflectance models requires to match the scope of the project to the surface conditions. However, the mentioned products assess canopy properties (expressed as spectral reflectances), from which an estimation of biomass is obtained. From the biomass plant properties and finally the yield can be estimated. The estimation of biomass has to be done several times a year to forecast crop parameters. This outlook is highly desirable and useful for agricultural management. At this point plant growth models, such as PROMET-V, are employed, in order to model the spatial distribution of different crop parameters for a certain time such as the plant growth/development and estimated yield. Those mostly raster based models use information on the terrain, net radiation, hydrological and other meteorological variables as well as afore investigated crop parameters (*) obtained from satellite imagery. The reliability of results lies around 97% on a regional scale and 90% for single parcels.
Summing up,the plant growth model estimates:
- Development of water content
- Progress of photosynthesis
- Development and gain of biomass (roots, leaves, stem, corn)
- Yield
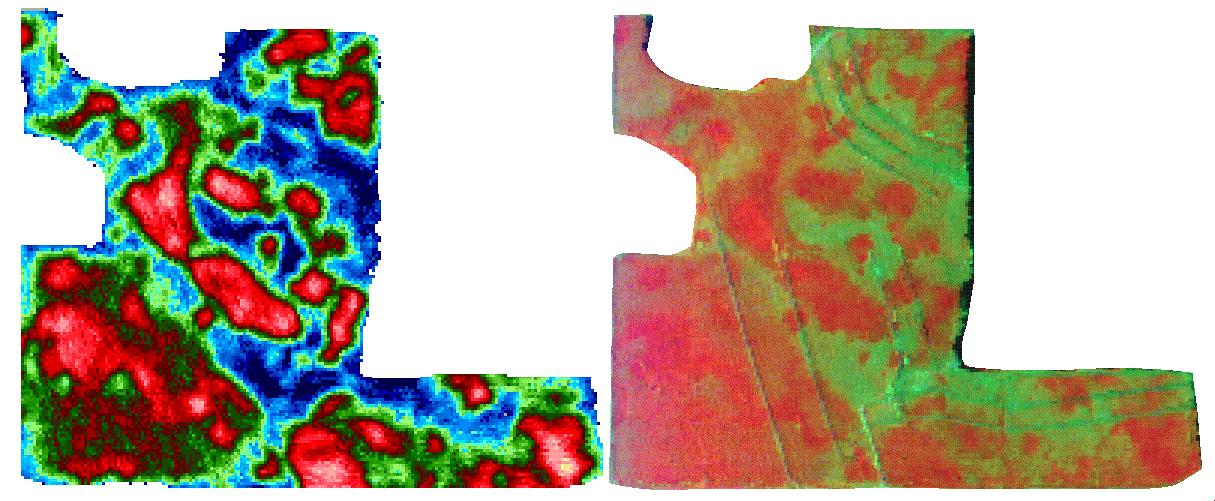
Yield (left) compared to remote sensing image two months earlier (right). Red corresponds to higher yields, blues and greens to lower yields. Source: NASA/Marshall and GHCC.
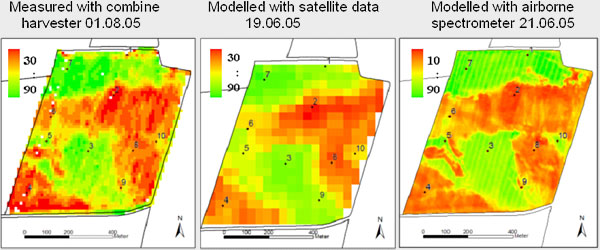
Yield measured by combine harvester (left), yield estimation based on multiangular CHRIS data (hyperspectral and multidirectional satellite sensor; middle) and AVIS data (Airborne Visible Infrared Imaging Spectrometer; right). Both images were taken around 6 weeks before harvest (June). Source: Vista GmbH
Furthermore, the spatial assessment of crop parameters allows the detection of heterogeneities within the planted area. For instance, certain canopy reflectances reveal areas of high and less crop vigor in a parcel, which enables the spatial adjustment of fertilisation. This application of remote sensing in agriculture is called precision farming/agriculture.
Further applications of modelling remote sensing data
- Monitoring of snow cover, estimation of stored water volume and modelling runoff
- Monitoring of floods in time and space
- Monitoring of soil moisture (radar)
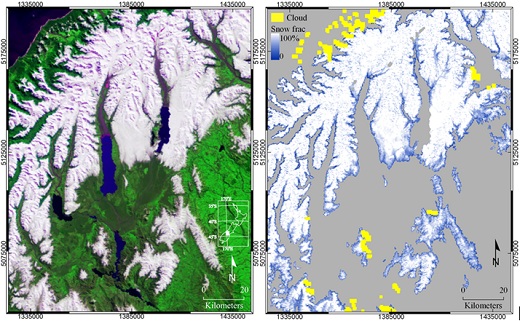
Snow monitoring based on MODIS 250m imagery. The spatial details in the maps were achieved by sub-pixel determination of snow fractions. Source: University of Otago, New Zealand.
Reference:
Andersen, H.-E., R.J. McGaughey, and S.E. Reutebuch. 2005. Estimating forest canopy fuel parameters using LIDAR data. Remote Sensing of Environment 94(4):441-449.

#

Next article


Few days ago, I met some scientist from Geology department. While talking, I have found Geologist/hydrologist/ ecologist ,…, are very much interested to find out a way to estimate water salinity without going to the field and measuring salinity by electrical conductivity. The first solution what came to my mind is very simple… I asked them “why don’t you monitor salinity from space?”. Then they asked, “how?”. I didn’t knew the answer then. That is how I get involved in these sort of topic and have started to look for a proper solution.
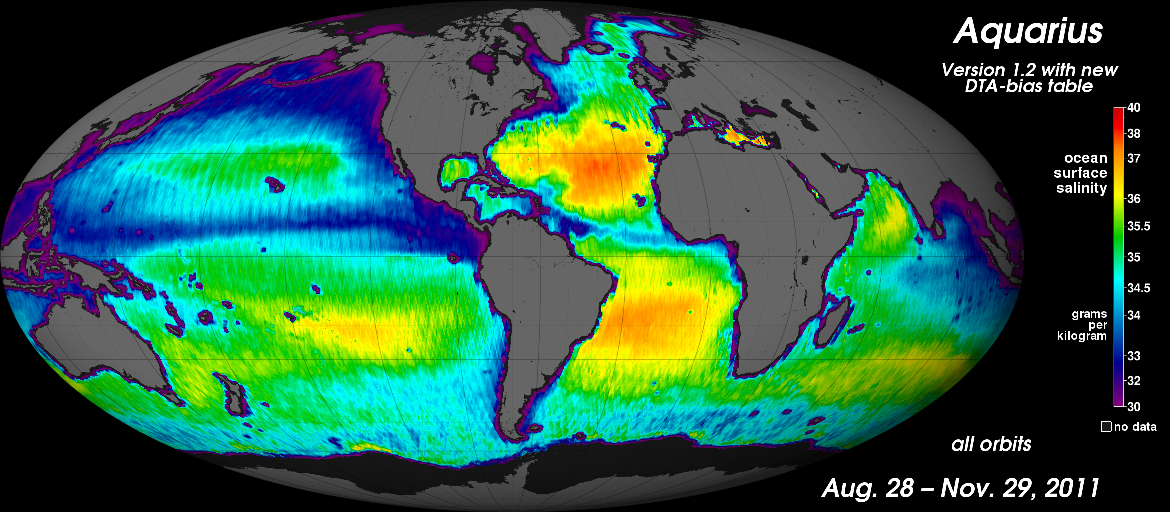
Sea Surface Salinity (SSS) dynamic studies are in the heart of several major scientific domains which play a vital role in sea water circulation patterns, influences the spatial distribution of many marine organisms, and affects seawater density in both coastal systems and open oceans.
Satellite remote sensing offers the potential to estimate salinity across entire water bodies at the frequency of satellite overpass, dramatically enhancing our monitoring capabilities relative to in situ observation networks. To date, however, satellite missions targeting salinity have focused on open ocean rather than coastal applications. NASA’s Aquarius mission, launched in June 2011, and the European Space Agency’s Soil Moisture and Ocean Salinity (SMOS) mission launched in November 2009, are capable of measuring SSS from space across the world’s oceans, but the 150 km spatial and 7-day temporal resolution of Aquarius and the 250 km spatial and 10–30 day average temporal resolution of SMOS are too coarse for coastal and Earnestine environments.
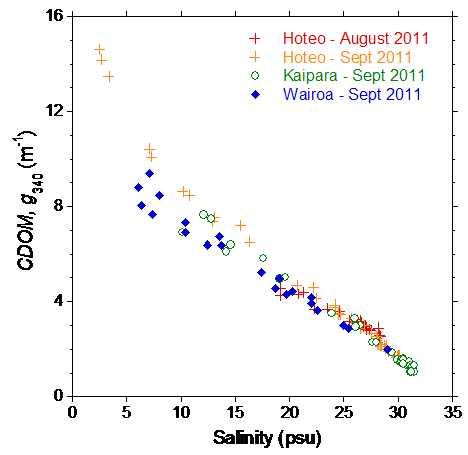
Attempts to successfully map SSS in the coastal region via remote sensing have ranged from Skylab photography to microwave radiometer measurements, decametric wave ranges, ESTAR measurements, and Landsat TM data. The use of satellite imagery to map SSS in an estuary was first performed in the San Francisco Bay. This pioneer study found correlations between Landsat TM color bands and SSS in an estuarine environment. Other studies explore the empirical relationships between colored dissolved organic matter (CDOM) and salinity using remotely sensed ocean color in a coastal setting. These sort of studies showed that a straight-line relationship between CDOM and salinity is expected dependent on the ratio of the flushing time of an estuary and the timescale of the source variation.
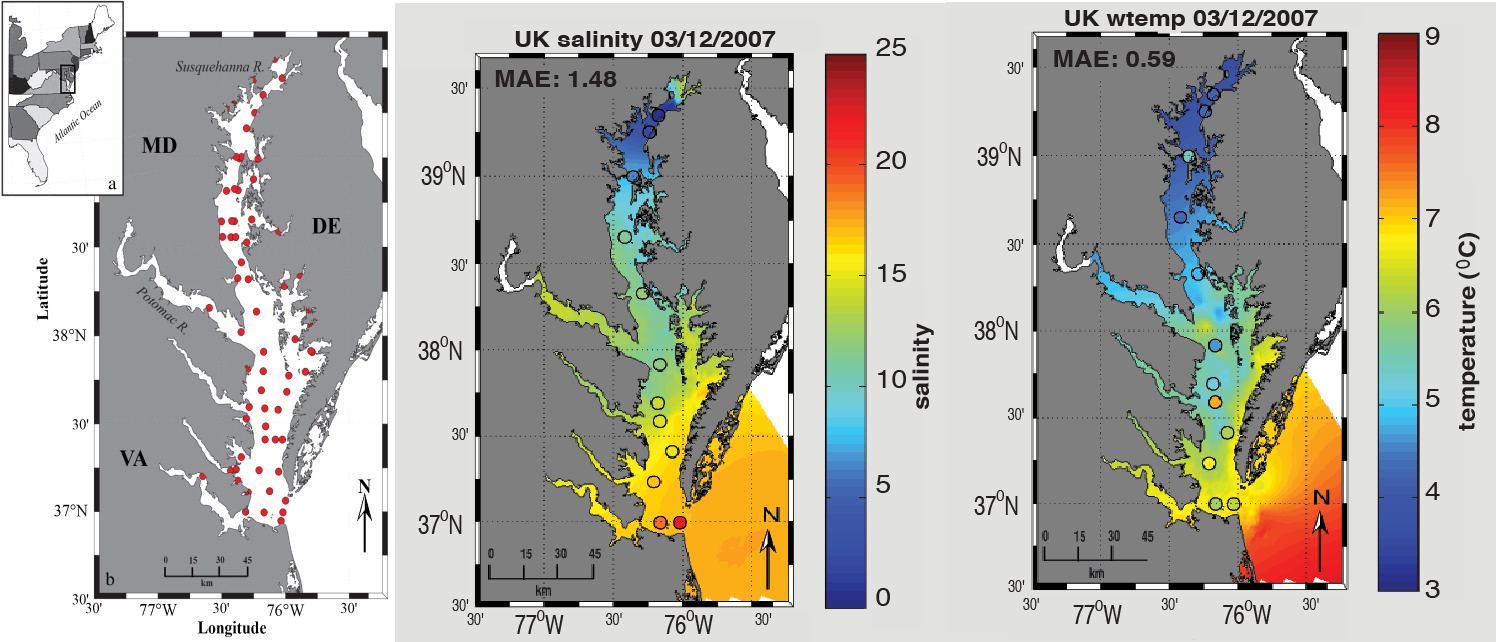
Recently one study has successfully predicted SSS in the Chesapeake Bay at 1 km resolution using MODIS-Aqua ocean color bands using multiple statistical models and an artificial neural network (ANN) algorithm applied to MODIS-Aqua data. Besides, some scientist modeled SSS from MODIS satellite data in the east coast of Malaysia, using oleast square model as compared to 2nd polynomial order algorithm .Others have also used satellite remote sensing to map low-salinity water plume in the East China Sea. There are also a similar kind of exercise to predict salinity from remote sensing for the Columbia River plume.
all these studies tried to predict salinity in the coastal ocean for an specific region using proper regional algorithms from large in-situ measurements of apparent and inherent optical properties. these studies have one common drawback and that is none of these algorithms and method can successfully predict the salinity of other region then their own. then again these studies have given a proper signal of the ability of measuring salinity from space but suffers from data and methodical limitations.
PROPOSAL: A good research proposal could be, an attempt or to establish a generic predictive algorithm which can successfully predict salinity of most of the coastal regions with a tolerable accuracy. To assure satellite data consistency with higher spatial and temporal resolution, the study may involve testing several method of atmospheric correction and interpolation techniques. the study also can be aided by several point process models from probability wing and/or some spatial autoregressive models (lattice approach) which can be devised to run auto regression in space and time simultaneously. As those spatio-temporal models are data dependent so the study may also involve extensive in-situ salinity measurement with higher temporal and spatial resolution from several/different physical and biological costal settings.