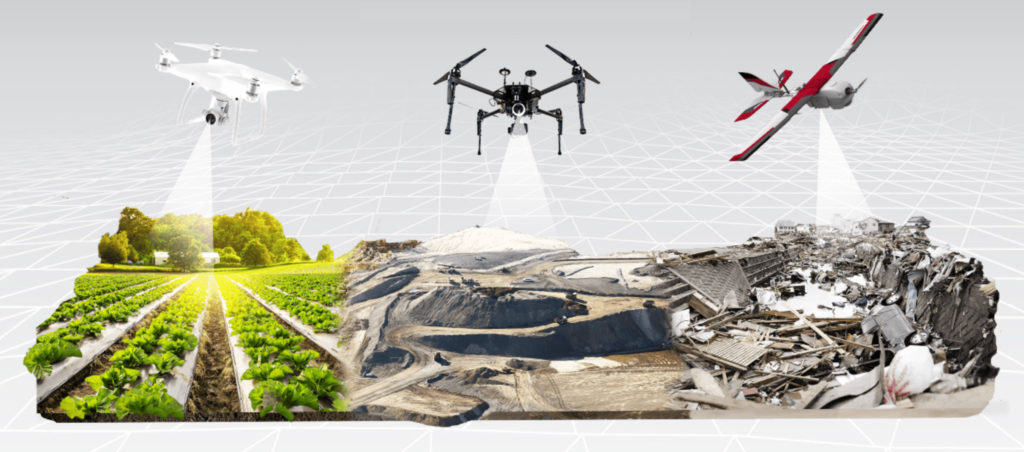

Drones seem to have the potential to revolutionize numerous areas of our lives, but today their biggest disruption is in the field of mapping. These small flying machines have made mapping any area or an object a matter of few minutes or hours, instead of the typical days or weeks it used to take before. In addition, this mapping equipment is accessible to even ‘non-experts’ because using a simple hobby drone like the DJI Phantom or DJI Mavic Pro will let you achieve survey-grade accuracy in a photogrammetric map or 3D model.
But what exactly is this ‘accuracy’? How do you define it, measure it, and verify it? And finally, what is the accuracy you actually need and how do you achieve it using UAVs? All these questions are really important if an aerial mapping business is your aim. In this industry, accuracy is the name of the game. And if you cannot define it and deliver it, you would end up offering your clients nothing more than a pretty picture from above.

Survey accuracy vs. pixel size
One of the most important parameters of your survey is the spatial resolution, which in photogrammetry terms is described as GSD (Ground Sampling Distance). In literature, it is defined as the distance between two consecutive pixel centers measured on the ground. In practice, it is simply the size of the pixel in the field.
The GSD depends on the parameters of the camera (mainly camera resolution and focal length) and the flight altitude. For example, to achieve 1 cm (3 inches) pixel size using a hobby drone like the DJI Mavic Pro, you will need to fly at an altitude of 25 m. Using a professional device like WingtraOne will let you achieve 1 cm GSD at 60m.
However, if you manage to complete your flight with a pixel size of 1 cm2 (0.16 in2), it doesn’t mean that the accuracy of your overall survey (or to be more exact, the output of your survey: Orthophotomap, Digital Surface Model, or 3D point cloud) is also 1 cm.
In photogrammetry, accuracy is always relative to positional accuracy, which is defined as the degree to which the information on the map created from the data captured matches the actual real world.
Relative and absolute accuracy
This is where things start to become interesting, as well as more complicated. It is one thing to generate an accurate photogrammetric model using a software like PrecisionMapper, or Pix4D. But fitting it accurately to a geodetic coordinate system is a different ball game altogether.
Drones are equipped with GPS units that allow you to properly stitch the images together and generate 3D models. However, this equipment is typically not accurate enough to place the said model exactly where it needs to be with centimeter-level accuracy.
To understand this better, you may measure the distance between two points on your reconstructed model and find the value is quite close to the value measured on the field. But a close inspection would reveal the points themselves might be 1 meter away from their real position on the Earth!
This is why in aerial surveying, accuracy in interpreted in two ways: relative and absolute. Relative accuracy is the measurement of how objects are positioned relative to each other in a reconstructed model (Orthophotomap, Digital Surface Model or 3D point cloud). Absolute accuracy refers to the difference between the location of the objects on the reconstructed model and their true position on the Earth (or a geodetic coordinate system).
For most small areas and simple use cases, the relative model would work just fine. It will let you measure distances, volumes and height differences and do operations like applying vegetation indexes to your data. However, if you need to create professional photogrammetric survey documentation, or combine your data with other data layers (e.g. GIS vector data) or do any operations with geographic coordinates in a geodetic reference system, you will need to perform the so-called absolute orientation of your reconstructed model using Ground Control Points or GCPs.
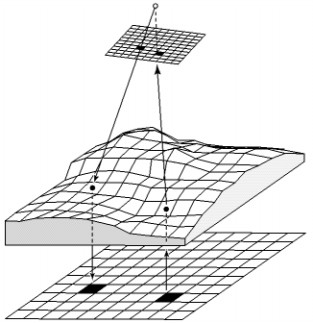
source: PrecisionMapper Support Website
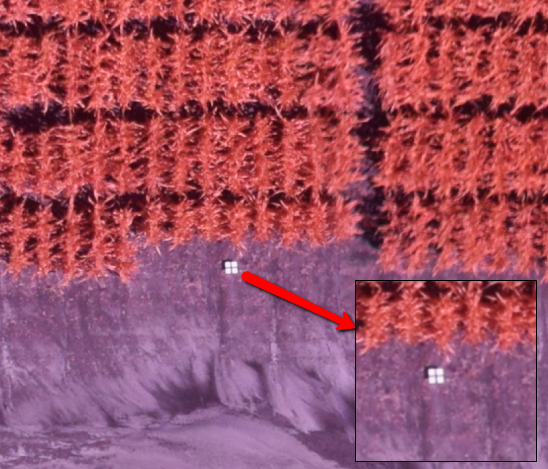
GCPs are visual markers on the ground whose coordinates are known. They help to increase the accuracy of your drone survey and allow you to fit the model in a geodetic coordinate system. These points must be measured by a land surveyor using professional equipment, such as the RTK GPS or a Total Station.
What influences drone survey accuracy?
The degree to which the absolute accuracy approaches the relative accuracy is determined by the overall quality of the photogrammetric process and the accuracy of the Ground Control Points.
The absolute accuracy of your survey can not be higher than the GCPs’ accuracy. Therefore, it is important to make sure the points are measured with an accuracy higher than the pixel size (e.g. if your pixel size is 1 cm, the GCPs should be optimally measured with sub-centimeter accuracy).
The absolute accuracy will also significantly depend on the relative accuracy of your model. When you stitch together hundreds or thousands of images taken with a small (and most often non-metric) drone camera, it is almost impossible to have each pixel on the map located exactly where it should be.
Additionally, there are a lot of factors that will influence the overall quality and accuracy of your survey. We will soon publish a dedicated post about these factors, but they include parameters like the terrain profile, drone hardware choice, image overlap, weather conditions, stability and the speed of the flight, and GPS conditions, among other things. Meanwhile, you can find more information here.
What accuracy can be achieved in drone photogrammetry?
When it comes to relative accuracy, the literature says you can expect an error of 1-3 times the pixel size for a correctly reconstructed model, both horizontally and vertically. This means that for a 2 cm GSD, one should be able to achieve accuracy in the range of 2-6 cm.
You must, however, remember that this error is not global. It may be larger in terrain with irregular altitudes or a terrain with no characteristic objects where identifying tie points becomes difficult to create a mosaic (e.g. forest, desert, and water).
With absolute accuracy, the literature says you can expect an error of 1-2 GSD horizontally and 1-3 GSD vertically for the correctly reconstructed model.
In a paper published by P. Barry and R. Coakley in 2015, Accuracy of UAV Photogrammetry Compared With Network RTK GPS, we find exactly the same conclusions. The researchers chose a 2ha site and flew a UAV over it aiming for 1 cm GSD with 80% front and side overlaps. They placed 10 Ground Control Points and 45 additional check points in the field and measured it using RTK GPS with millimeter accuracy. After performing the flight and processing the data, the researchers measured the errors between the orthophotomap/DEM, and the coordinates of those 45 check points measured with RTK GPS.
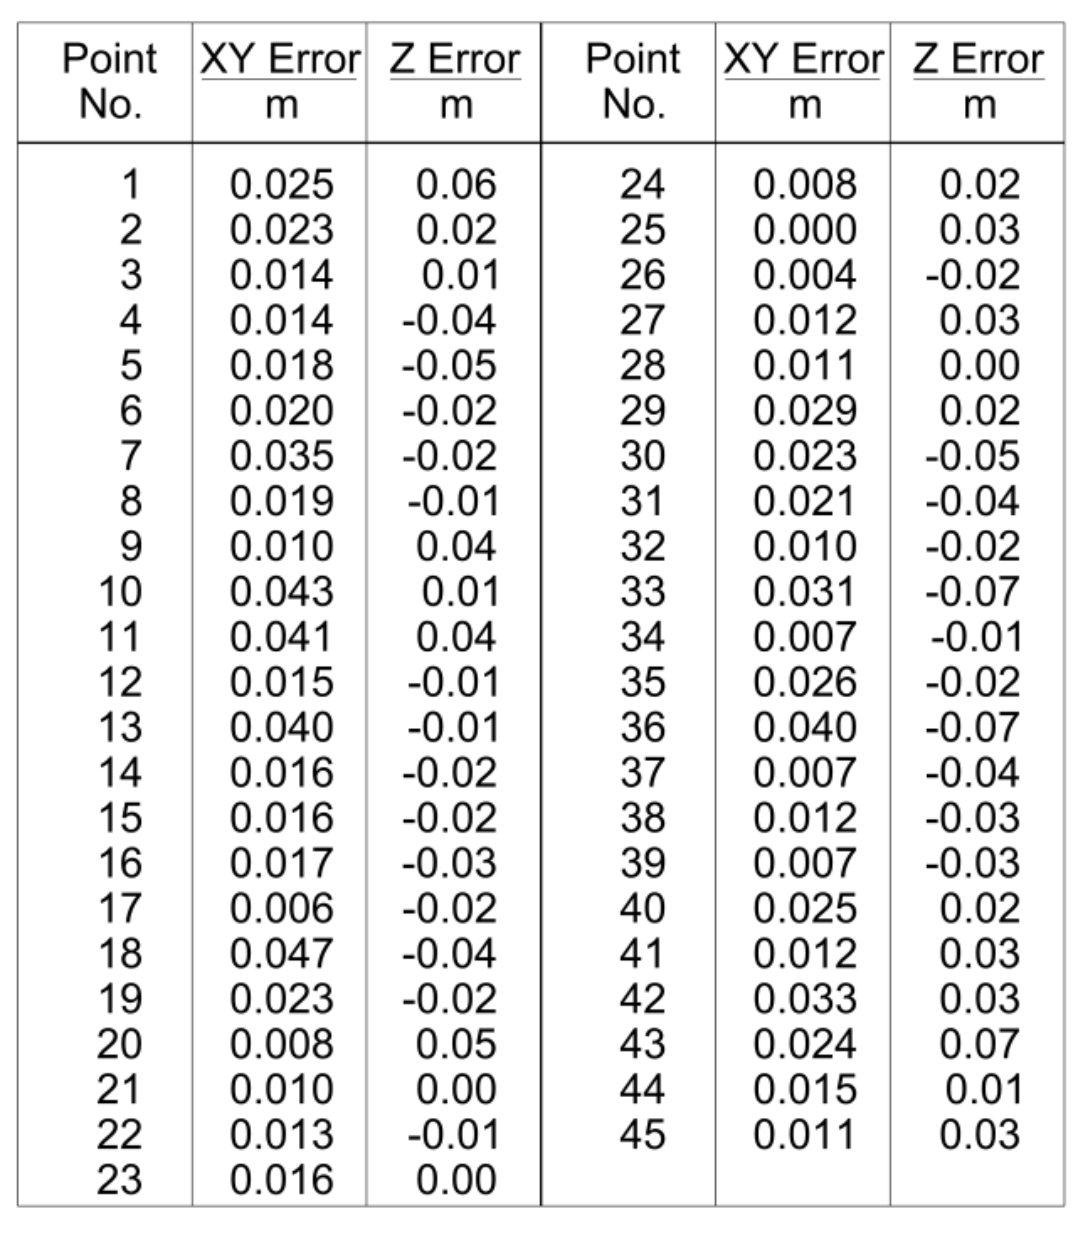
The dataset of measured errors between the Orthomosaic/DEM Network RTK GPS for the target centers.
The accuracy they achieved throughout the 45 check points and with a 1cm ground sampling distance was high. The mean error and root-mean-square error (RSME) was at the level of 2 times GSD in XY and 3 times GSD in the Z axis.
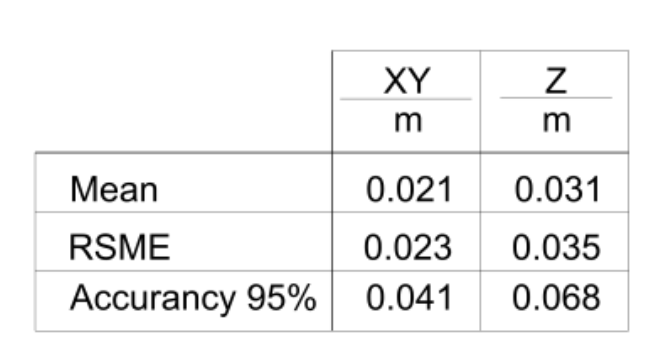
In the end, the researchers used the methodology from Geospatial Positioning Accuracy Standards, Part 3: National Standard for Spatial Data Accuracy and applied 95% confidence level to the results (planimetrically 1.7308 x RMSEr and vertically as 1.9600 x RMSEz) and concluded the final accuracy at the level of 41mm horizontally and 68mm vertically.
How do you know if your drone survey is accurate or not?
The difficulty is that an accurate orthophotomap, DEM or 3D model very often looks identical to an inaccurate one. If you have good GPS conditions, stable flight and decent weather conditions in addition to a regular terrain with many characteristic points (that can be used to match images) as well as a proper image overlap, the model should be pretty accurate, but the only way to determine that is to calculate an error study similar to the one mentioned above.
A good practice is to measure several check points in the field, besides the Ground Control Points. The check points will let you calculate the accuracy of the model using regular surveying calculation methods.
If you have done your survey without measuring any points in the field, you can still calculate the accuracy by measuring distances between characteristic points, e.g., length of a wall, the distance between two buildings, etc. You can do it using a $50 – $150 laser distance sensor that provides 1mm accuracy on the distance up to 100 m. We will go through the exact calculation methods in a separate post.
Why and when do you need accurate drone survey data?
The accuracy requirements of any survey depend on its final application and the use case. In many cases, 30 cm (1 foot) will be more than enough, while on other projects 2 cm is the maximum acceptable error.
According to the USGS Global Navigation Satellite System Committee, matching the accuracy requirements of the project and choosing the right equipment is the sole responsibility of the surveyor. Survey accuracy standards are defined by local institutions in each state in the US as well as most of the countries around the world but the regulations are more or less similar. In the US, the main standardization body for aerial mapping data is American Society of Photogrammetry & Remote Sensing (ASPRS) and a key document is Positional Accuracy Standards for Digital Geospatial Data, published in 2014.
You must remember that while the resolution and the accuracy should not be lower than required, it also shouldn’t be higher. A survey of 1 km2 with 1 cm resolution generates over 180 GB of raw data that needs to be processed, stored and delivered to the client. 2 cm resolution creates 4 times less data (up to 45 GB) and requires 4 times fewer resources for processing and storage. Therefore, from an economic perspective, it is crucial to understand the requirements and not overpromise resolution and accuracy where they are not required.
We hope this post will help you get an in-depth understanding of drone data accuracy and will help you avoid common problems. Stay tuned for more articles about drone mapping!


#Business


Next article

Both Google and Apple keep updating their map apps periodically with fancy new features. From remembering where our car is parked to packing in a punch of indoor mapping capabilities, they have been there, done that. But what’s the most basic thing users require from a map? That it should be able to tell them where something is located with unfailing accuracy. After all, what good is a map that keeps cycling through businesses plotted at the same location? Sadly, that’s exactly what Apple Maps has been doing.
Justin O’Beirne, who has worked on maps at Apple and has been blogging about cartography for years, undertook a rather interesting project recently. From May 2016 to June 2017, he tracked the map apps of Google and Apple to see how a San Francisco location changed on the maps over time. He documented his findings in an essay which shows how the maps have evolved over the past year with still images and mesmerizing GIFs.
His conclusion? “It’s cool to see how much Google Maps has changed over the past year. But it’s also surprising to see how little Apple Maps has changed.”
To be fair, on Apple’s map, places are added and removed on a monthly basis. Google does the same. But, Google’s month-to-month changes are only half of what Apple is churning out. Now, does that mean Apple is updating its map more often?
Not necessarily, according to O’Beirne who took a hard look at three businesses located next to each other. While Google has a distinct location for each business, Apple plots them at the same location. And then as the months pass by, Apple keeps toggling between the businesses, leading to a surge in the number of places it adds on or removes from its map.
Now, it’s up to you whether you want to commend Google for using computer vision and machine learning to update addresses through its Street View cars, or blame Apple for its dependence on TomTom for mapping data (and a possibly buggy geocoder). The reality is that Apple still has a long way to go before it catches up with Google. Apple also recognizes this and has stepped up efforts to make its location data better, including mulling the use of drones to update maps faster.
But as O’Beirne’s analysis clearly shows, not only has Apple bungled at ground zero by not being able to populate its maps with quality data, it has been pretty lazy with the map interface as well. While Google took the pain to make its data display as user-friendly as possible over the last year by doing everything from tweaking color schemes to changing the contrast, Apple did absolutely nothing!
“Over the course of a year, Google quietly turned its map inside-out – transforming it from a road map into a place map. A year ago, the roads were the most prominent part of the map – the thing you noticed first. Now, the places are,” O’Beirne notes. This, of course, would also help Google to make money off its maps, as CEO Sundar Pichai recently revealed.
Back in 2012, when Apple Maps debuted, they were so inaccurate and crummy that CEO Tim Cook had to issue a public apology. “We are extremely sorry for the frustration this has caused our customers and we are doing everything we can to make Maps better… Everything we do at Apple is aimed at making our products the best in the world. We know that you expect that from us, and we will keep working non-stop until Maps lives up to the same incredibly high standard,” Cook said. Seems like four and a half years have not been enough for Apple to deliver on that promise.
Now read: Why would you use OpenStreetMap if there is Google Maps?