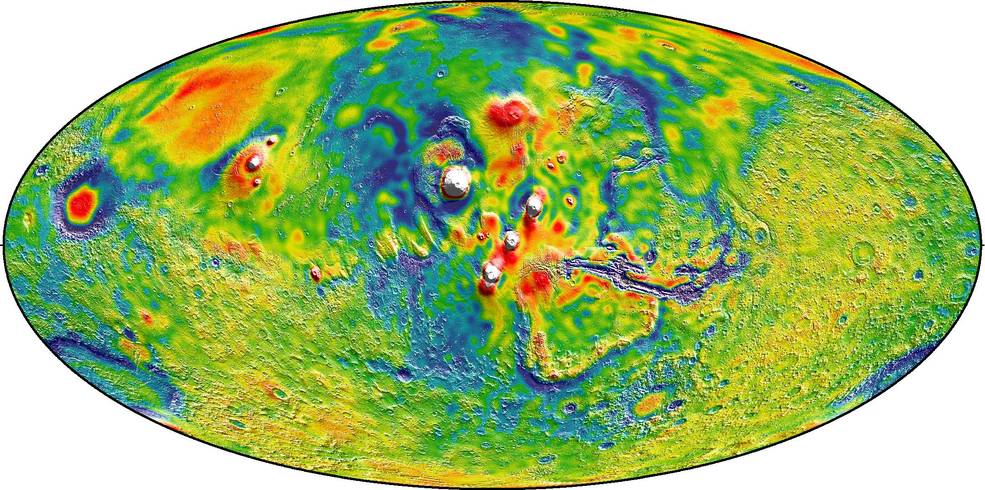
The Martian gravity map is the buzz of the space world. NASA has released the most accurate gravity map of the red planet paving a way to peek into the it’s interior properties of the planet.
“Gravity maps allow us to see inside a planet, just as a doctor uses an X-ray to see inside a patient,” said Antonio Genova of the Massachusetts Institute of Technology (MIT), Cambridge, Massachusetts. The Doppler and range tracking data collected by NASA’s Deep Space Network from three of NASA’s spacecraft orbiting around Mars – Mars Global Surveyor (1996), Mars Odyssey (2001) and Mars Reconnaissance Orbiter (2005) for more than 16 years were utilised for the creation of the high-resolution Mars Gravitational Chart.
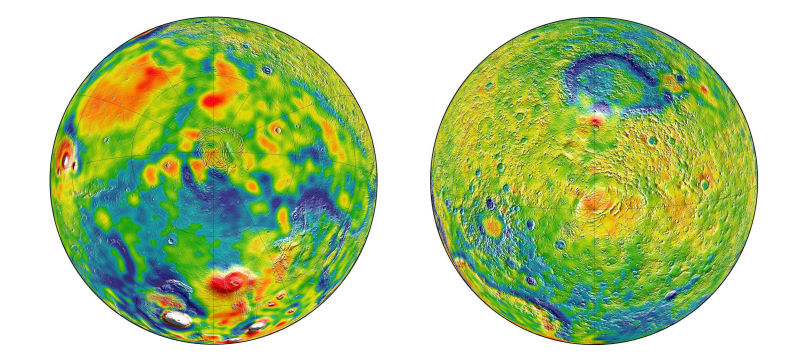
White and Red indicates the areas of higher gravity, Blue indicates areas of lower of gravity of North and South poles respectively.
The process behind the mapping of gravity anomaly involved the precise plotting of Gravity fluctuations experienced by the spacecraft as they orbit around the planet. Like all planets, Mars is lumpy, which causes the gravitational pull felt by the spacecraft to change. For instance, NASA explained, Mars’ gravitational pull is slightly stronger over mountains than over valleys, and changes when close to craters and other prominent features. The impact of Sunlight on Orbiting Solar Panels and also the pull from the thin upper atmosphere contribute to the change in trajectory of the spacecraft. Delicate analysis and computer modelling were performed for almost two initial years to filter fluctuations not caused by gravity.
The improved resolution of the anomalies 62miles (100KM) suggests a new explanation for how some features formed across the boundary that divides the relatively smooth northern lowlands from heavily cratered southern highlands. Also, the team confirmed that Mars has a liquid outer core of molten rock by analysing tides in the Martian crust and mantle caused by the gravitational pull of the sun and the two moons of Mars with a resolution of 75miles (120KM).
By observing how Mars’ gravity changed over 11 years – the period of an entire cycle of solar activity, the team inferred the massive amount of carbon dioxide 3 to 4 trillion i.e., 12 to 16 percent of the entire atmosphere – that freezes onto a Martian polar ice cap when it experiences winter. They also observed how that mass moves between the South Pole and the North Pole with the change of season in each hemisphere.
With these new findings and confirmations Earth is moving closer to its closest neighbour, via NASA.
[youtube https://www.youtube.com/watch?v=iDTDNIh4Qhw]


#


Next article

Click to open a large version in the new window
Humans have always dreamed about spaceflights, but only in the second half of the 20th century, we developed rockets that were powerful enough to overcome the force of gravity to reach orbital velocities that could open space to human exploration.
Everything started in 1957 when the Soviets launched the first artificial satellite, Sputnik 1, into space. The first U.S. satellite, Explorer 1, went into orbit one year later in 1958. In 1961 the next milestone was space exploration had been achieved – Yuri Gagarin became the first human to orbit Earth. His flight lasted 108 minutes, and Gagarin reached an altitude of about 202 miles (327 kilometers). We had to wait 8 years to 1969 for Astronaut Neil Armstrong to take “one giant leap for mankind” as he stepped onto the moon… The road to space exploration has been long and often bumpy, but we have managed to achieve a lot.
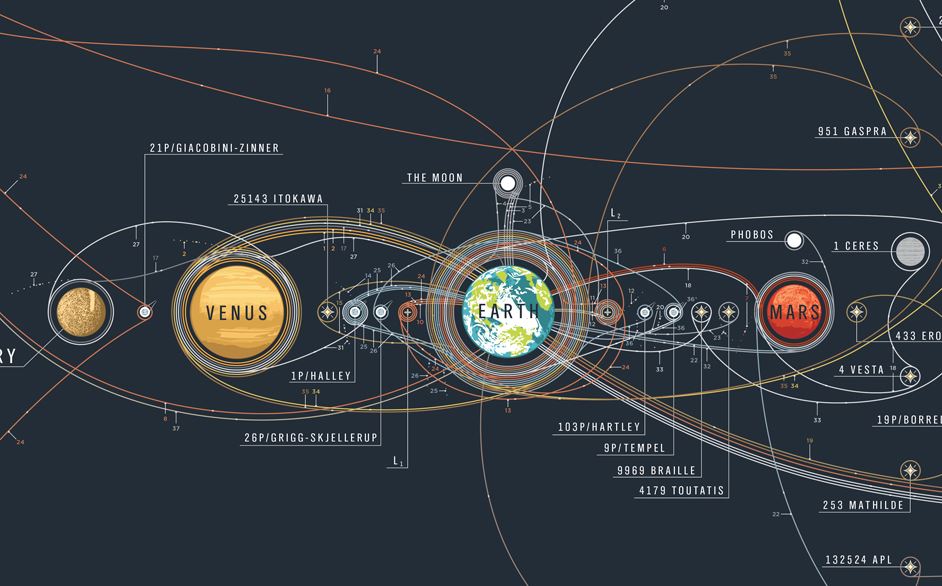
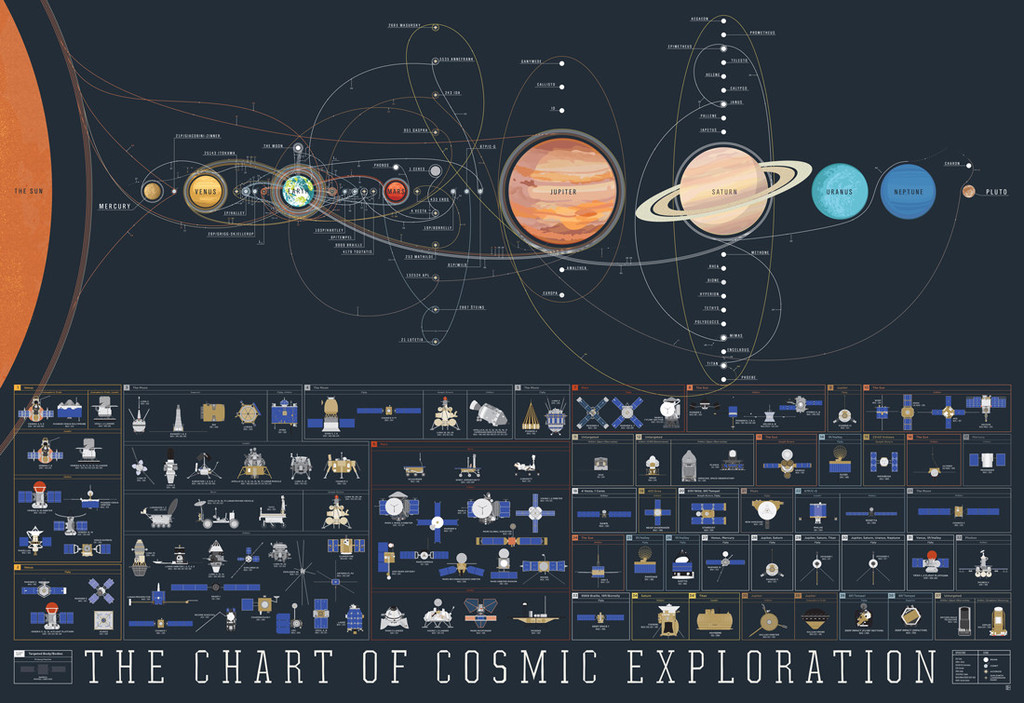
The awesome poster called Chart of Cosmic Exploration documents every major space mission starting from the Luna 2 in 1959 to the DSCOVR in 2015. The map traces the trajectories of every orbiter, lander, rover, flyby, and impactor which ever left the Earth’s orbit and completed its mission. Additionally, each poster features an array of over 100 exploratory instruments with hand-illustrated renderings of each spacecraft. It’s awesome and beautiful!